
2nd Quarter FY2013 Earnings Release Parker Hannifin Corporation Exhibit 99.2 January 18, 2013
Forward-Looking Statements Forward-looking statements contained in this and other written and oral reports are made based on known events and circumstances at the time of release, and as such, are subject in the future to unforeseen uncertainties and risks. All statements regarding future performance, earnings projections, events or developments are forward-looking statements. It is possible that the future performance and earnings projections of the company, including its individual segments, may differ materially from current expectations, depending on economic conditions within its mobile, industrial and aerospace markets, and the company's ability to maintain and achieve anticipated benefits associated with announced realignment activities, strategic initiatives to improve operating margins, actions taken to combat the effects of the current economic environment, and growth, innovation and global diversification initiatives. A change in the economic conditions in individual markets may have a particularly volatile effect on segment performance. Among other factors which may affect future performance are: changes in business relationships with and purchases by or from major customers, suppliers or distributors, including delays or cancellations in shipments, disputes regarding contract terms or significant changes in financial condition, changes in contract cost and revenue estimates for new development programs and changes in product mix; ability to identify acceptable strategic acquisition targets; uncertainties surrounding timing, successful completion or integration of acquisitions; ability to realize anticipated cost savings from business realignment activities; threats associated with and efforts to combat terrorism; uncertainties surrounding the ultimate resolution of outstanding legal proceedings, including the outcome of any appeals; competitive market conditions and resulting effects on sales and pricing; increases in raw material costs that cannot be recovered in product pricing; the company’s ability to manage costs related to insurance and employee retirement and health care benefits; and global economic factors, including manufacturing activity, air travel trends, currency exchange rates, difficulties entering new markets and general economic conditions such as inflation, deflation, interest rates and credit availability. The company makes these statements as of the date of this disclosure, and undertakes no obligation to update them unless otherwise required by law. 2
Non-GAAP Financial Measures This presentation reconciles sales amounts reported in accordance with U.S. GAAP to sales amounts adjusted to remove the effects of acquisitions made within the prior four quarters and the effects of currency exchange rates. This presentation also reconciles cash flow from operating activities as a percent of sales in accordance with U.S. GAAP to cash flow from operating activities as a percent of sales without the effect of a discretionary pension plan contribution. The effects of acquisitions, currency exchange rates and the discretionary pension plan contribution are removed to allow investors and the company to meaningfully evaluate changes in sales and cash flow from operating activities as a percent of sales on a comparable basis from period to period. 3
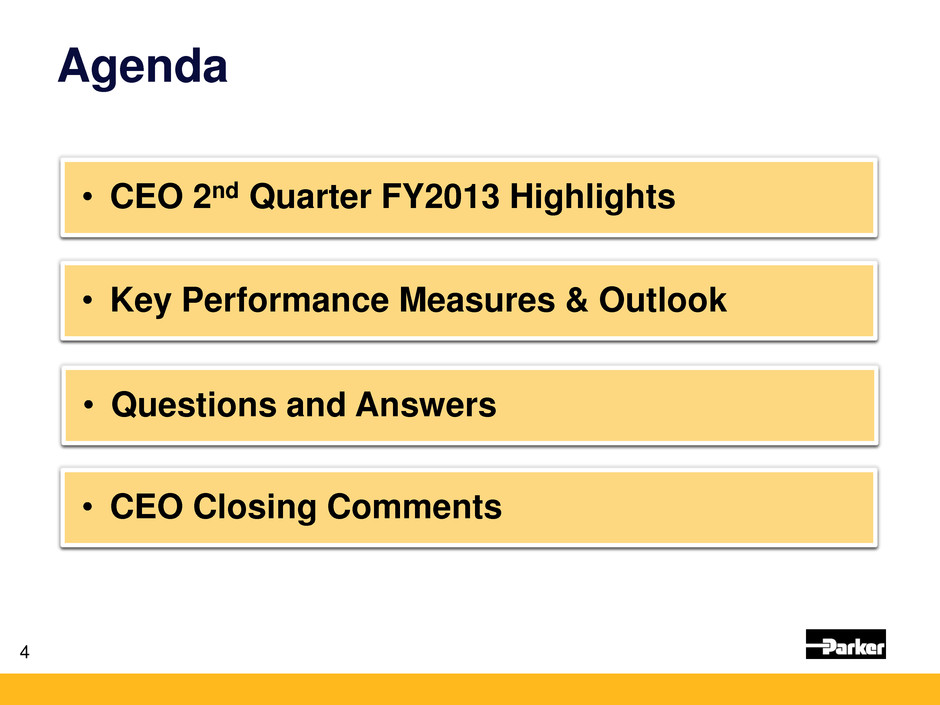
Agenda 4 • CEO 2nd Quarter FY2013 Highlights • Key Performance Measures & Outlook • CEO Closing Comments • Questions and Answers
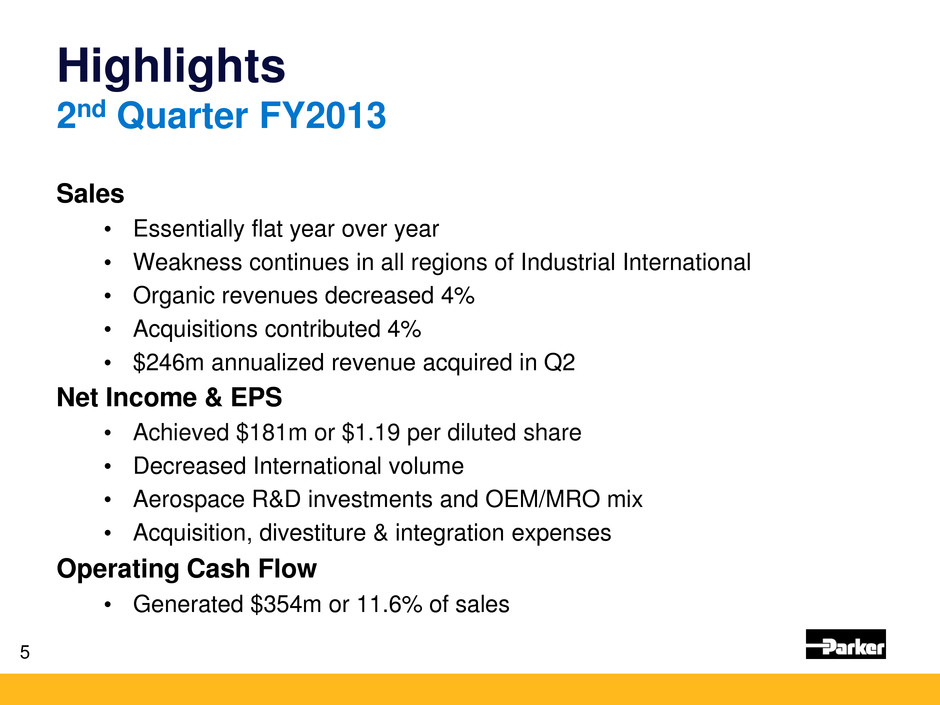
Highlights 2nd Quarter FY2013 Sales • Essentially flat year over year • Weakness continues in all regions of Industrial International • Organic revenues decreased 4% • Acquisitions contributed 4% • $246m annualized revenue acquired in Q2 Net Income & EPS • Achieved $181m or $1.19 per diluted share • Decreased International volume • Aerospace R&D investments and OEM/MRO mix • Acquisition, divestiture & integration expenses Operating Cash Flow • Generated $354m or 11.6% of sales 5
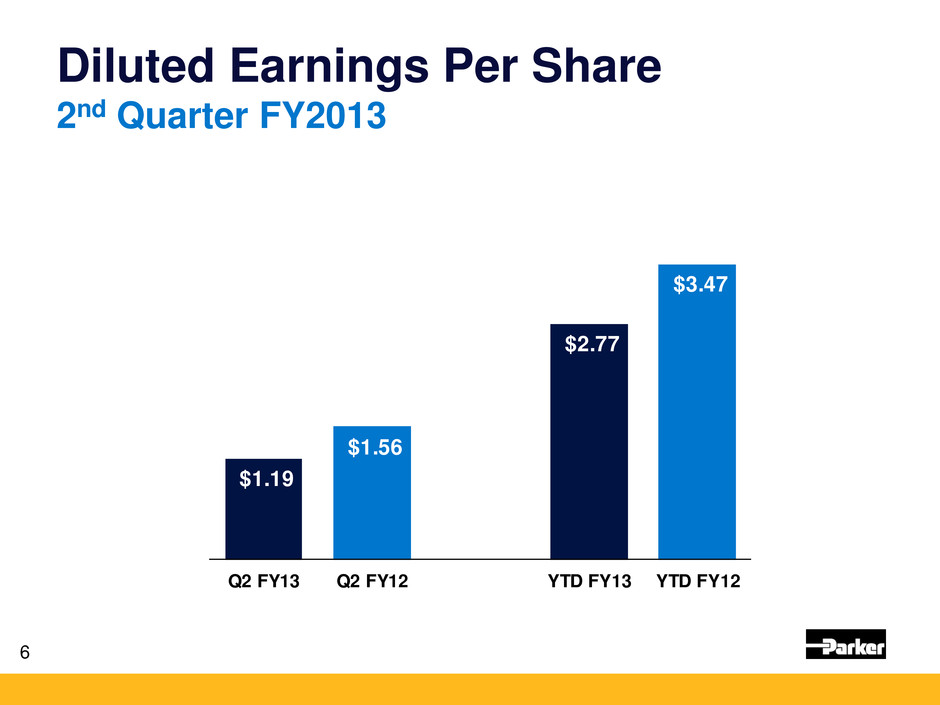
Diluted Earnings Per Share 2nd Quarter FY2013 6 $1.19 $1.56 $2.77 $3.47 0.00 0.50 1.00 1.50 2.00 2.50 3.00 3.50 4.00 Q2 FY13 Q2 FY12 YTD FY13 YTD FY12
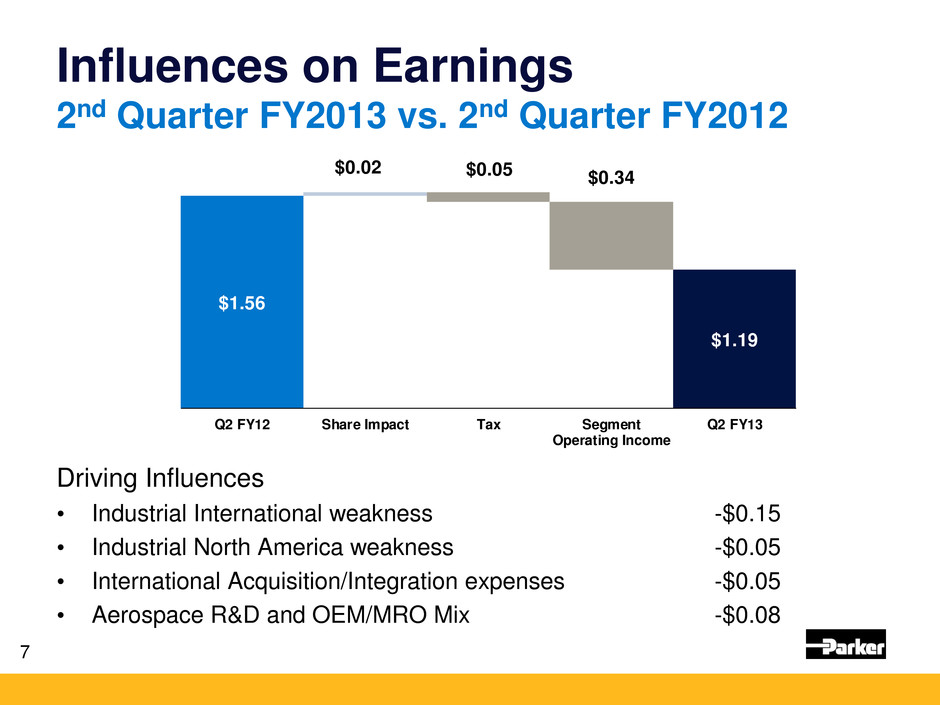
$1.56 $0.02 $0.05 $0.34 $1.19 Q2 FY12 Share Impact Tax Segment Operating Income Q2 FY13 Influences on Earnings 2nd Quarter FY2013 vs. 2nd Quarter FY2012 Driving Influences • Industrial International weakness -$0.15 • Industrial North America weakness -$0.05 • International Acquisition/Integration expenses -$0.05 • Aerospace R&D and OEM/MRO Mix -$0.08 7
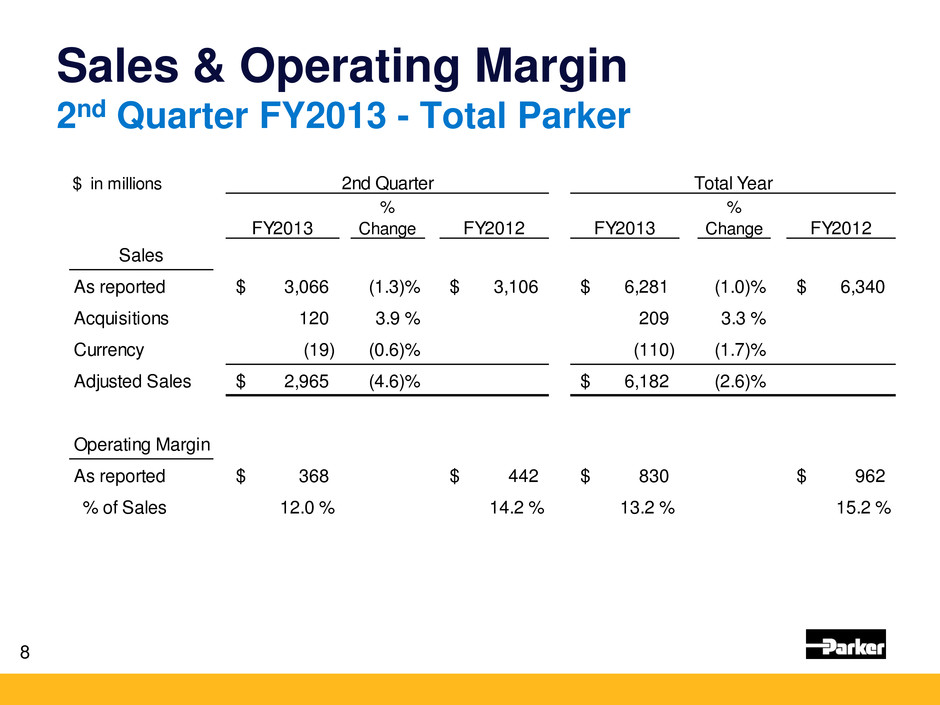
Sales & Operating Margin 2nd Quarter FY2013 - Total Parker 8 $ in millions FY2013 % Change FY2012 FY2013 % Change FY2012 Sales As reported 3,066$ (1.3)% 3,106$ 6,281$ (1.0)% 6,340$ Acquisitions 120 3.9 % 209 3.3 % Currency (19) (0.6)% (110) (1.7)% Adjusted Sales 2,965$ (4.6)% 6,182$ (2.6)% Operating Margin As reported 368$ 442$ 830$ 962$ % of Sales 12.0 % 14.2 % 13.2 % 15.2 % 2nd Quarter Total Year
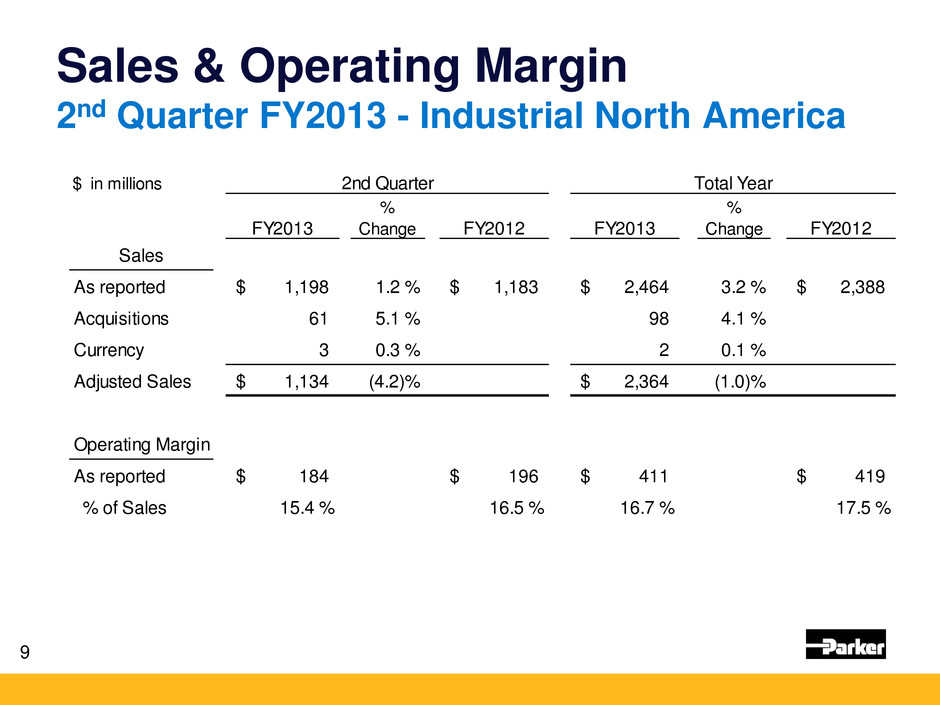
Sales & Operating Margin 2nd Quarter FY2013 - Industrial North America 9 $ in millions FY2013 % Change FY2012 FY2013 % Change FY2012 Sales As reported 1,198$ 1.2 % 1,183$ 2,464$ 3.2 % 2,388$ Acquisitions 61 5.1 % 98 4.1 % Currency 3 0.3 % 2 0.1 % Adjusted Sales 1,134$ (4.2)% 2,364$ (1.0)% Operating Margin As reported 184$ 196$ 411$ 419$ % of Sales 15.4 % 16.5 % 16.7 % 17.5 % Total Year2nd Quarter
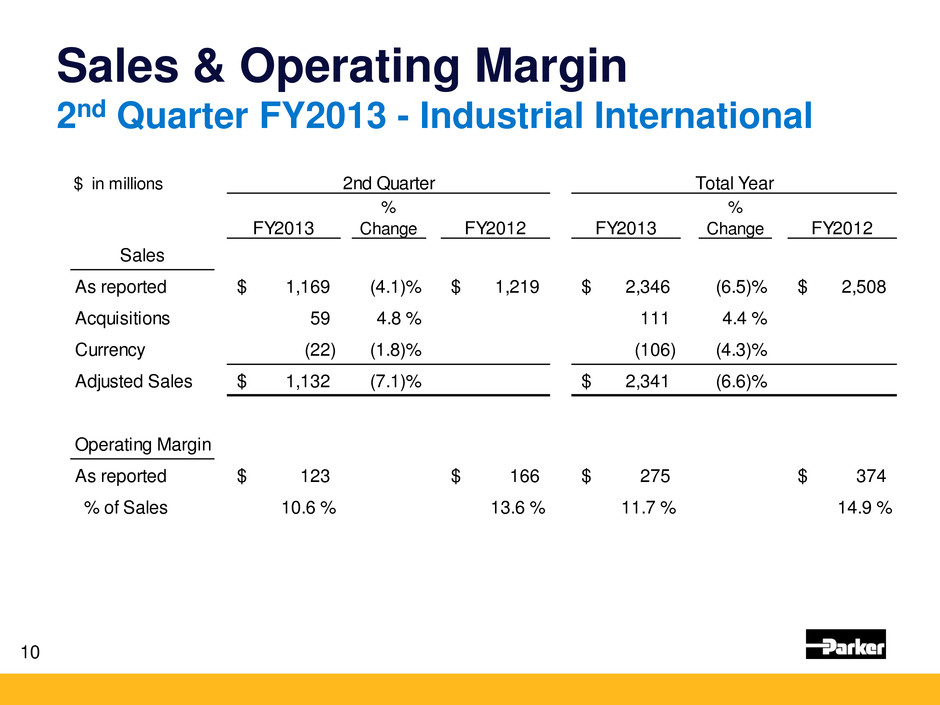
Sales & Operating Margin 2nd Quarter FY2013 - Industrial International 10 $ in millions FY2013 % Change FY2012 FY2013 % Change FY2012 Sales As reported 1,169$ (4.1)% 1,219$ 2,346$ (6.5)% 2,508$ Acquisitions 59 4.8 % 111 4.4 % Currency (22) (1.8)% (106) (4.3)% Adjusted Sales 1,132$ (7.1)% 2,341$ (6.6)% Operating Margin As reported 123$ 166$ 275$ 374$ % of Sales 10.6 % 13.6 % 11.7 % 14.9 % 2nd Quarter Total Year
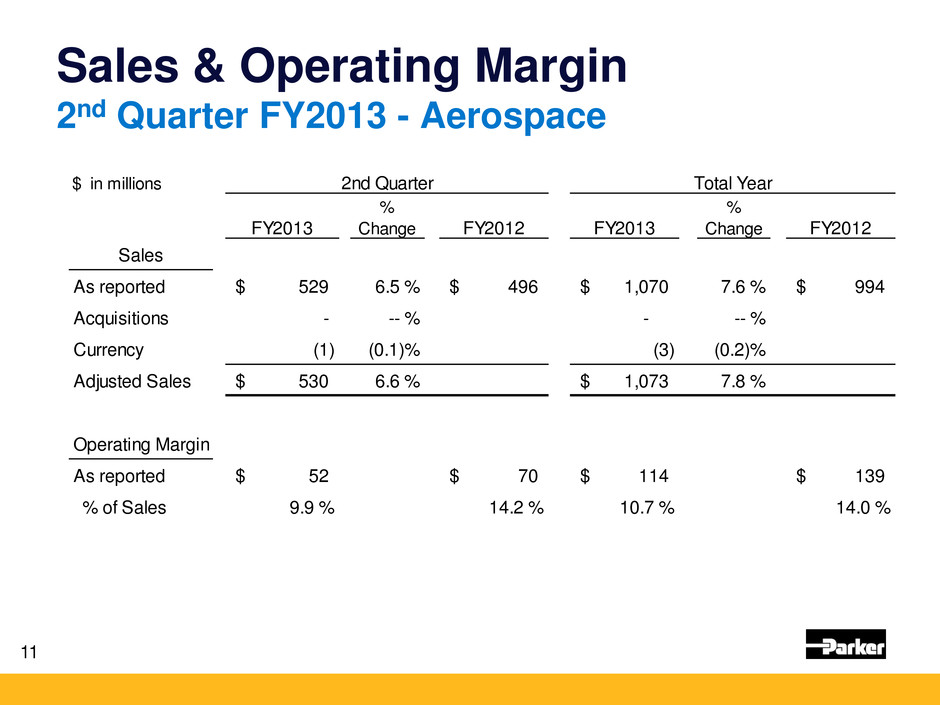
Sales & Operating Margin 2nd Quarter FY2013 - Aerospace 11 $ in millions FY2013 % Change FY2012 FY2013 % Change FY2012 Sales As reported 529$ 6.5 % 496$ 1,070$ 7.6 % 994$ Acquisitions - -- % - -- % Currency (1) (0.1)% (3) (0.2)% Adjusted Sales 530$ 6.6 % 1,073$ 7.8 % Operating Margin As reported 52$ 70$ 114$ 139$ % of Sales 9.9 % 14.2 % 10.7 % 14.0 % 2nd Quarter Total Year
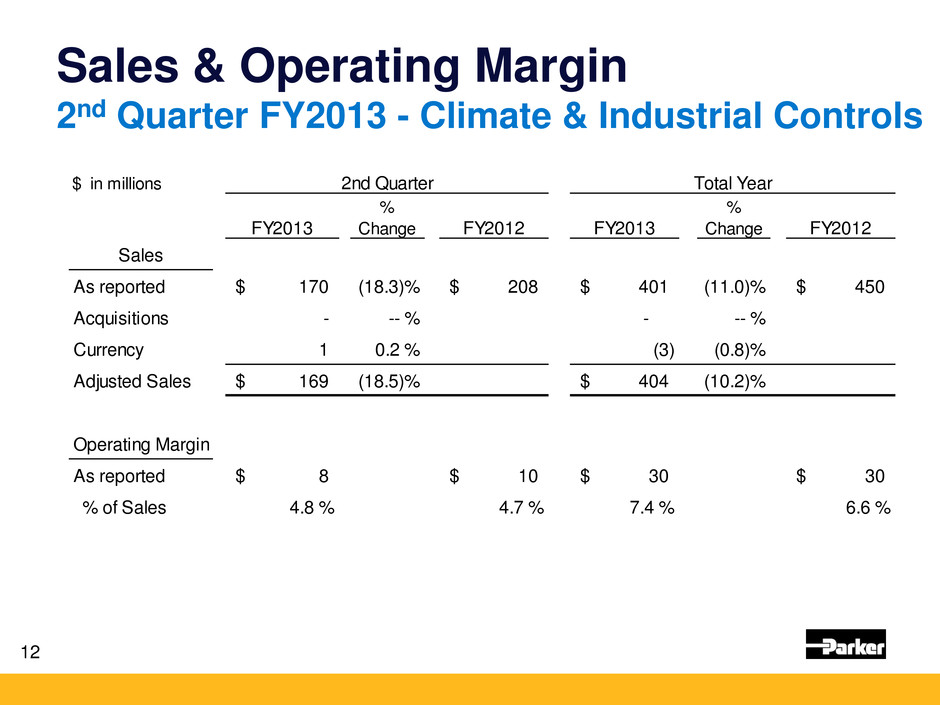
Sales & Operating Margin 2nd Quarter FY2013 - Climate & Industrial Controls 12 $ in millions FY2013 % Change FY2012 FY2013 % Change FY2012 Sales As reported 170$ (18.3)% 208$ 401$ (11.0)% 450$ Acquisitions - -- % - -- % Currency 1 0.2 % (3) (0.8)% Adjusted Sales 169$ (18.5)% 404$ (10.2)% Operating Margin As reported 8$ 10$ 30$ 30$ % of Sales 4.8 % 4.7 % 7.4 % 6.6 % 2nd Quarter Total Year
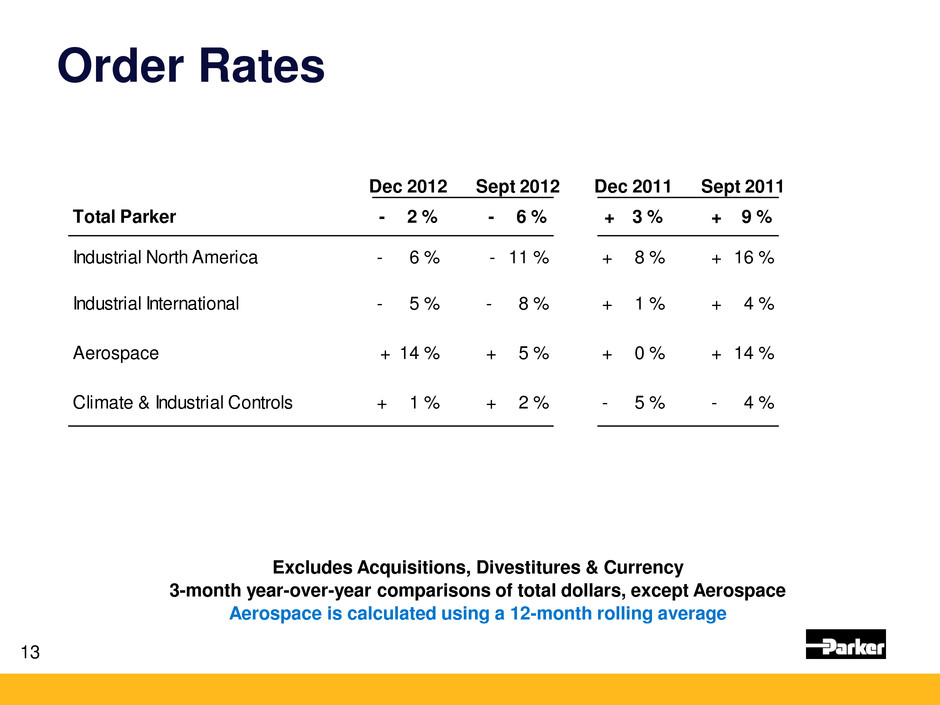
Order Rates 13 Excludes Acquisitions, Divestitures & Currency 3-month year-over-year comparisons of total dollars, except Aerospace Aerospace is calculated using a 12-month rolling average Dec 2012 Sept 2012 Dec 2011 Sept 2011 Total Parker 2 %- 6 %- 3 %+ 9 %+ Industrial North America 6 %- 11 %- 8 %+ 16 %+ Industrial International 5 %- 8 %- 1 %+ 4 %+ Aerospace 14 %+ 5 %+ 0 %+ 14 %+ Climate & Industrial Controls 1 %+ 2 %+ 5 %- 4 %-
Balance Sheet Summary • Cash • Working capital • Accounts receivable • Inventory • Accounts payable 14
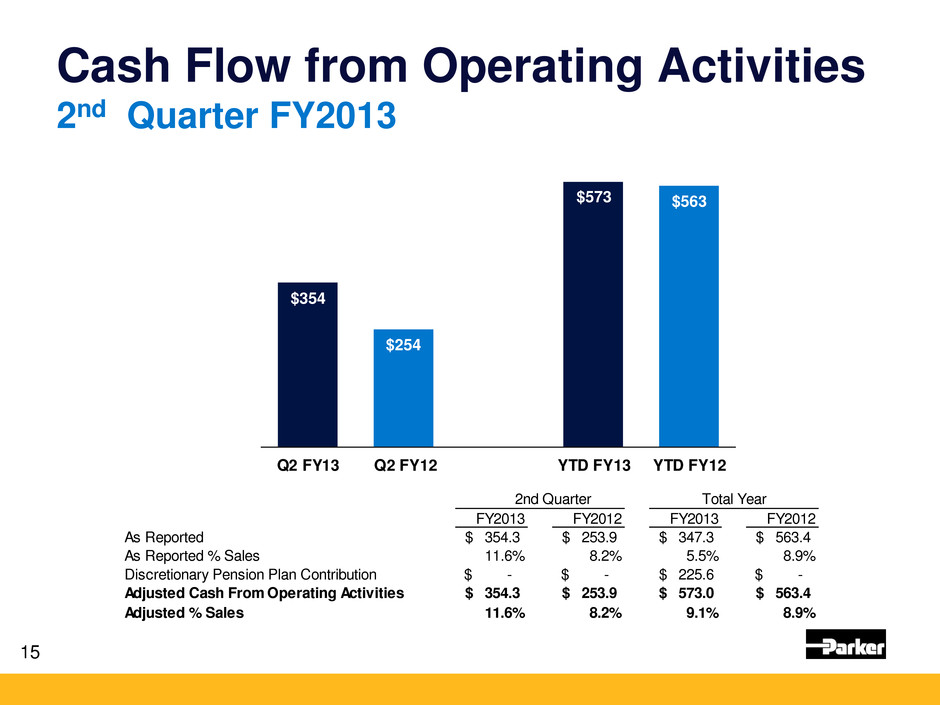
Cash Flow from Operating Activities 2nd Quarter FY2013 15 2nd Quarter Total Year FY2013 FY2012 FY2013 FY2012 As Reported 354.3$ 253.9$ 347.3$ 563.4$ As Reported % Sales 11.6% 8.2% 5.5% 8.9% Discretionary Pension Plan Contribution -$ -$ 225.6$ -$ Adjusted Cash From Operating Activities 354.3$ 253.9$ 573.0$ 563.4$ Adjusted % Sales 11.6% 8.2% 9.1% 8.9% $354 $254 $573 $563 Q2 FY13 Q2 FY12 YTD FY13 YTD FY12
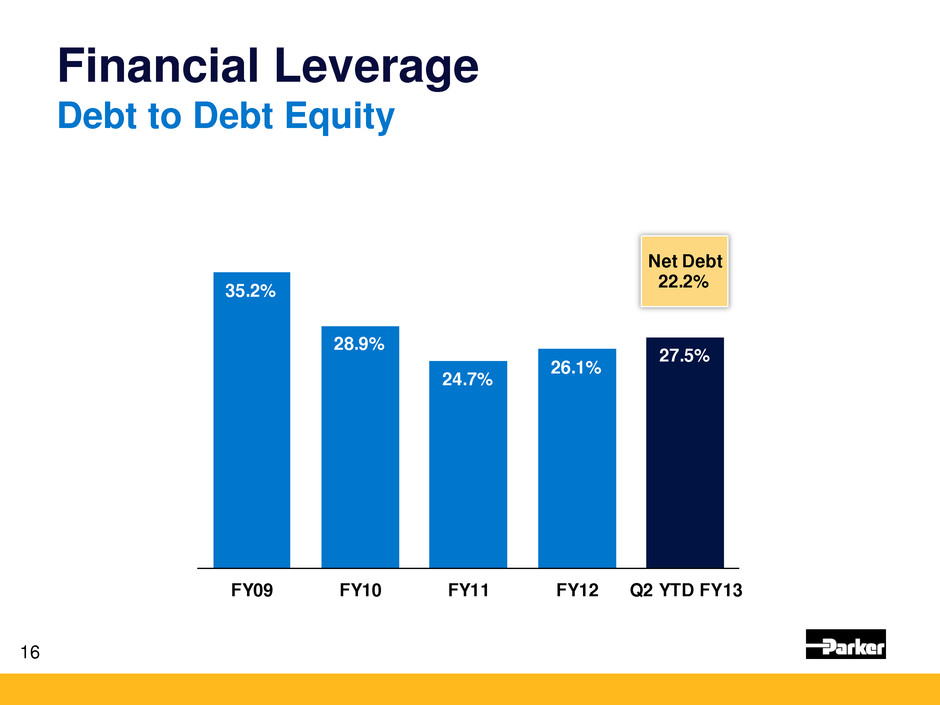
Financial Leverage Debt to Debt Equity 16 35.2% 28.9% 24.7% 26.1% 27.5% FY09 FY10 FY11 FY12 Q2 YTD FY13 Net Debt 22.2%
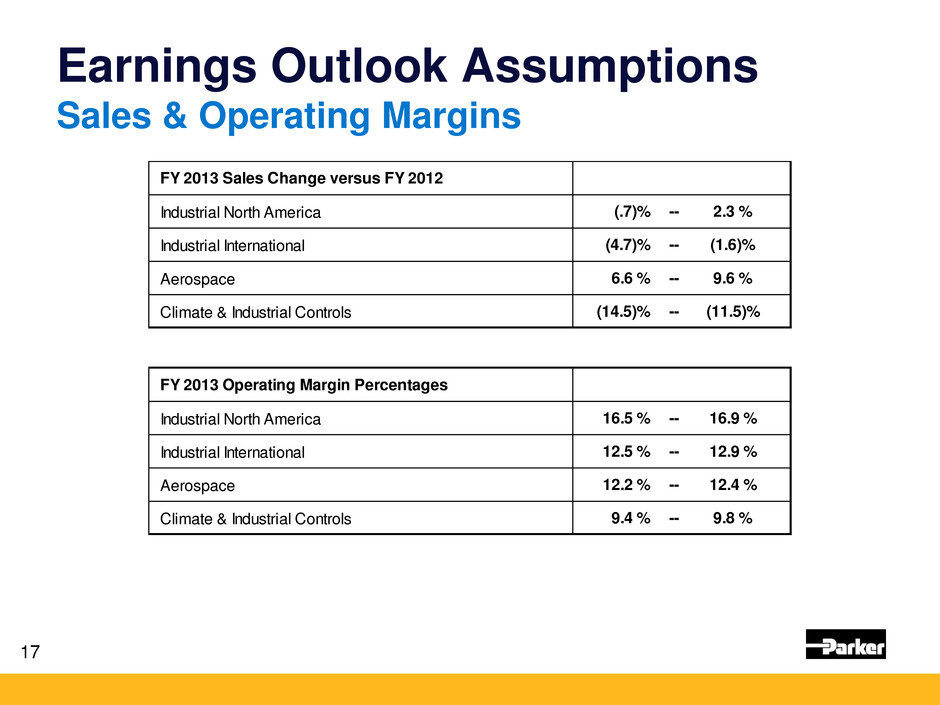
FY 2013 Sales Change versus FY 2012 Industrial North America (.7)% -- 2.3 % Industrial International (4.7)% -- (1.6)% Aerospace 6.6 % -- 9.6 % Climate & Industrial Controls (14.5)% -- (11.5)% FY 2013 Operating Margin Percentages Industrial North America 16.5 % -- 16.9 % Industrial International 12.5 % -- 12.9 % Aerospace 12.2 % -- 12.4 % Climate & Industrial Controls 9.4 % -- 9.8 % Earnings Outlook Assumptions Sales & Operating Margins 17
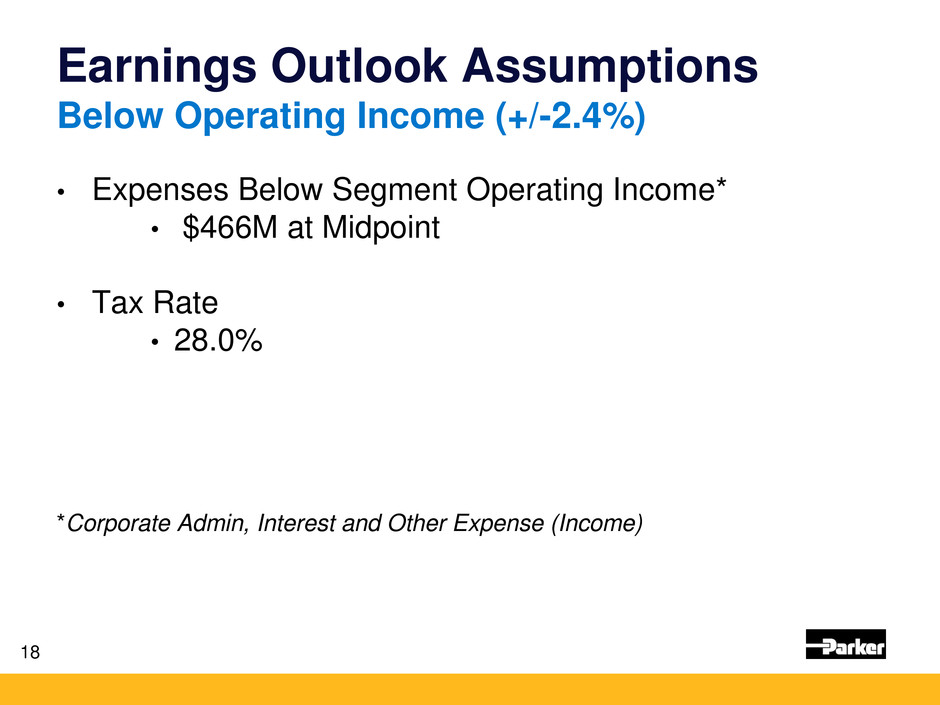
Earnings Outlook Assumptions Below Operating Income (+/-2.4%) • Expenses Below Segment Operating Income* • $466M at Midpoint • Tax Rate • 28.0% *Corporate Admin, Interest and Other Expense (Income) 18
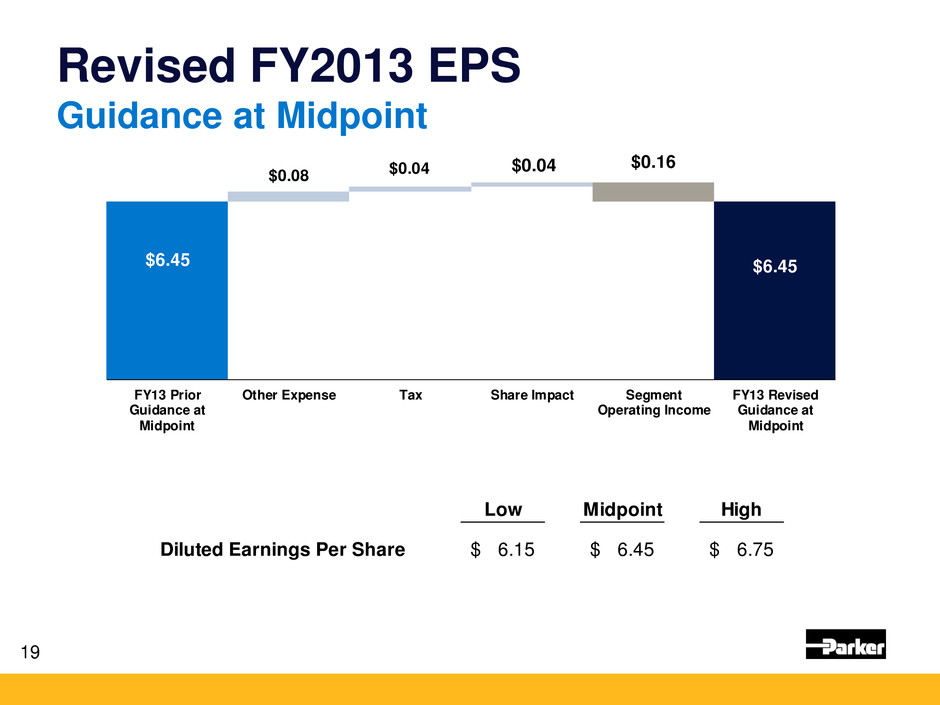
$6.45 $0.08 $0.04 $0.04 $0.16 $6.45 FY13 Prior Guidance at Midpoint Other Expense Tax Share Impact Segment Operating Income FY13 Revised Guidance at Midpoint Revised FY2013 EPS Guidance at Midpoint 19 Low Midpoint High Diluted Earnings Per Share 6.15$ 6.45$ 6.75$
Parker Hannifin Corporation The Global Leader in Motion & Control Technologies 20 • Questions and Answers

Thank You
Appendix • Consolidated Statement of Income • Business Segment Information By Industry • Consolidated Balance Sheet • Consolidated Statement of Cash Flows
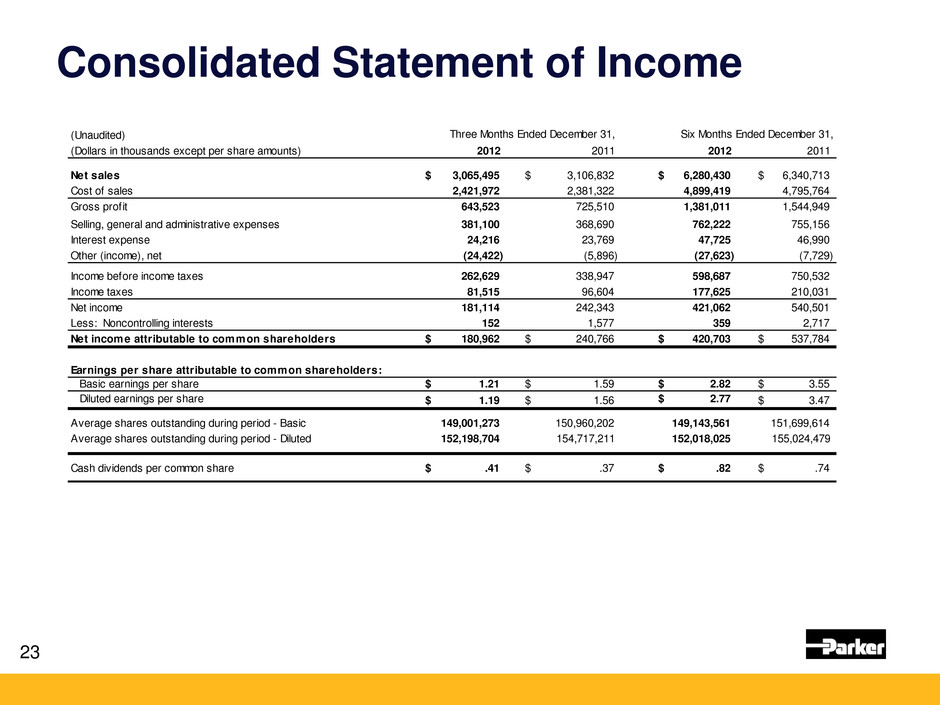
Consolidated Statement of Income 23 (Unaudited) Three Months Ended December 31, Six Months Ended December 31, (Dollars in thousands except per share amounts) 2012 2011 2012 2011 Net sales 3,065,495$ 3,106,832$ 6,280,430$ 6,340,713$ Cost of sales 2,421,972 2,381,322 4,899,419 4,795,764 Gross profit 643,523 725,510 1,381,011 1,544,949 Selling, general and administrative expenses 381,100 368,690 762,222 755,156 Interest expense 24,216 23,769 47,725 46,990 Other (income), net (24,422) (5,896) (27,623) (7,729) Income before income taxes 262,629 338,947 598,687 750,532 Income taxes 81,515 96,604 177,625 210,031 Net income 181,114 242,343 421,062 540,501 Less: Noncontrolling interests 152 1,577 359 2,717 Net income attributable to common shareholders 180,962$ 240,766$ 420,703$ 537,784$ Earnings per share attributable to common shareholders: Basic earnings per share 1.21$ 1.59$ 2.82$ 3.55$ Diluted earnings per share 1.19$ 1.56$ 2.77$ 3.47$ Average shares outstanding during period - Basic 149,001,273 150,960,202 149,143,561 151,699,614 Average shares outstanding during period - Diluted 152,198,704 154,717,211 152,018,025 155,024,479 Cash dividends per common share .41$ .37$ .82$ .74$
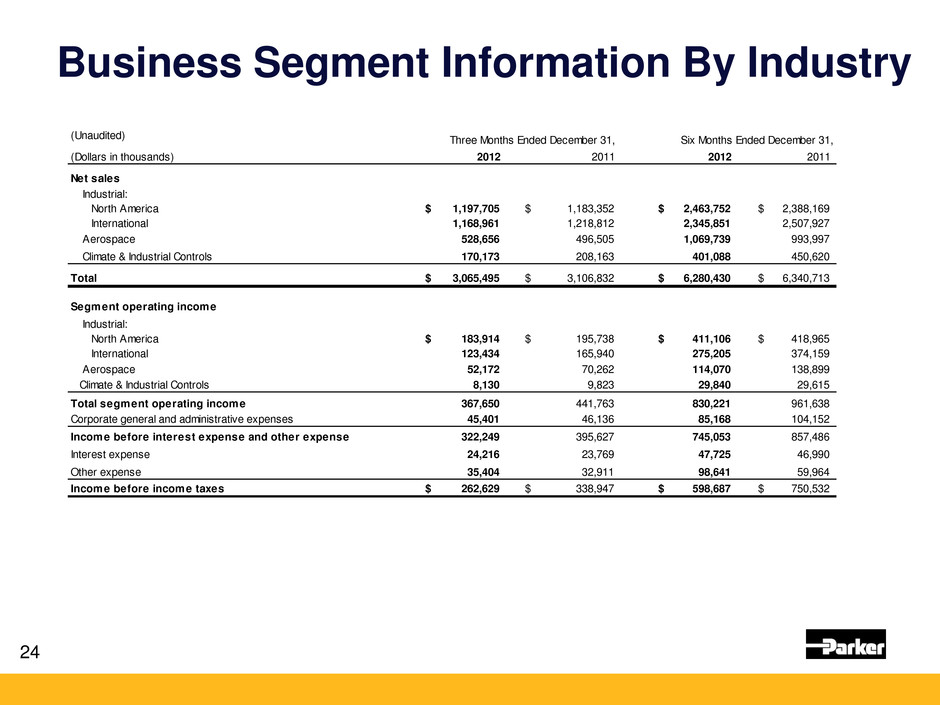
Business Segment Information By Industry 24 (Unaudited) Three Months Ended December 31, Six Months Ended December 31, (Dollars in thousands) 2012 2011 2012 2011 Net sales Industrial: North America 1,197,705$ 1,183,352$ 2,463,752$ 2,388,169$ International 1,168,961 1,218,812 2,345,851 2,507,927 Aerospace 528,656 496,505 1,069,739 993,997 Climate & Industrial Controls 170,173 208,163 401,088 450,620 Total 3,065,495$ 3,106,832$ 6,280,430$ 6,340,713$ Segment operating income Industrial: North America 183,914$ 195,738$ 411,106$ 418,965$ International 123,434 165,940 275,205 374,159 Aerospace 52,172 70,262 114,070 138,899 Climate & Industrial Controls 8,130 9,823 29,840 29,615 Total segment operating income 367,650 441,763 830,221 961,638 Corporate general and administrative expenses 45,401 46,136 85,168 104,152 Income before interest expense and other expense 322,249 395,627 745,053 857,486 Interest expense 24,216 23,769 47,725 46,990 Other expense 35,404 32,911 98,641 59,964 Income before income taxes 262,629$ 338,947$ 598,687$ 750,532$
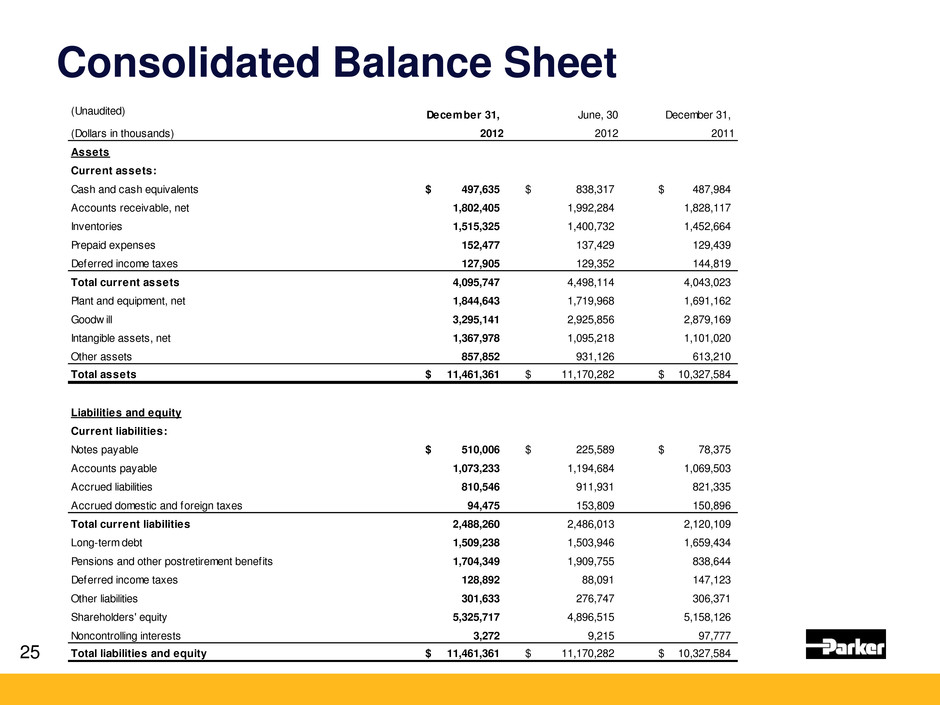
Consolidated Balance Sheet 25 (Unaudited) December 31, June, 30 December 31, (Dollars in thousands) 2012 2012 2011 Assets Current assets: Cash and cash equivalents 497,635$ 838,317$ 487,984$ Accounts receivable, net 1,802,405 1,992,284 1,828,117 Inventories 1,515,325 1,400,732 1,452,664 Prepaid expenses 152,477 137,429 129,439 Deferred income taxes 127,905 129,352 144,819 Total current assets 4,095,747 4,498,114 4,043,023 Plant and equipment, net 1,844,643 1,719,968 1,691,162 Goodw ill 3,295,141 2,925,856 2,879,169 Intangible assets, net 1,367,978 1,095,218 1,101,020 Other assets 857,852 931,126 613,210 Total assets 11,461,361$ 11,170,282$ 10,327,584$ Liabilities and equity Current liabilities: Notes payable 510,006$ 225,589$ 78,375$ Accounts payable 1,073,233 1,194,684 1,069,503 Accrued liabilities 810,546 911,931 821,335 Accrued domestic and foreign taxes 94,475 153,809 150,896 Total current liabilities 2,488,260 2,486,013 2,120,109 Long-term debt 1,509,238 1,503,946 1,659,434 Pensions and other postretirement benefits 1,704,349 1,909,755 838,644 Deferred income taxes 128,892 88,091 147,123 Other liabilities 301,633 276,747 306,371 Shareholders' equity 5,325,717 4,896,515 5,158,126 Noncontrolling interests 3,272 9,215 97,777 Total liabilities and equity 11,461,361$ 11,170,282$ 10,327,584$
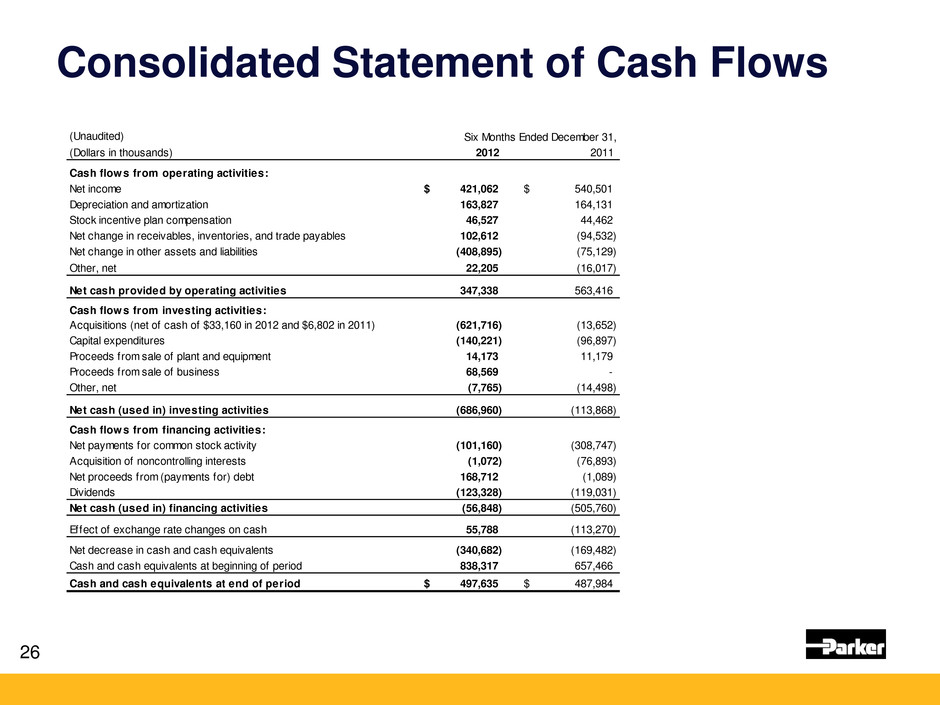
Consolidated Statement of Cash Flows 26 (Unaudited) Six Months Ended December 31, (Dollars in thousands) 2012 2011 Cash flows from operating activities: Net income 421,062$ 540,501$ Depreciation and amortization 163,827 164,131 Stock incentive plan compensation 46,527 44,462 Net change in receivables, inventories, and trade payables 102,612 (94,532) Net change in other assets and liabilities (408,895) (75,129) Other, net 22,205 (16,017) Net cash provided by operating activities 347,338 563,416 Cash flows from investing activities: Acquisitions (net of cash of $33,160 in 2012 and $6,802 in 2011) (621,716) (13,652) Capital expenditures (140,221) (96,897) Proceeds from sale of plant and equipment 14,173 11,179 Proceeds from sale of business 68,569 - Other, net (7,765) (14,498) Net cash (used in) investing activities (686,960) (113,868) Cash flows from financing activities: Net payments for common stock activity (101,160) (308,747) Acquisition of noncontrolling interests (1,072) (76,893) Net proceeds from (payments for) debt 168,712 (1,089) Dividends (123,328) (119,031) Net cash (used in) financing activities (56,848) (505,760) Effect of exchange rate changes on cash 55,788 (113,270) Net decrease in cash and cash equivalents (340,682) (169,482) Cash and cash equivalents at beginning of period 838,317 657,466 Cash and cash equivalents at end of period 497,635$ 487,984$