Parker Hannifin Corporation Fiscal 2021 Fourth Quarter & Full Year Earnings Presentation August 5, 2021 Exhibit 99.2
Forward-Looking Statements and Non-GAAP Financial Measures 2 Forward-looking statements contained in this and other written and oral reports are made based on known events and circumstances at the time of release, and as such, are subject in the future to unforeseen uncertainties and risks. These statements may be identified from the use of forward-looking terminology such as “anticipates,” “believes,” “may,” “should,” “could,” “potential,” “continues,” “plans,” “forecasts,” “estimates,” “projects,” “predicts,” “would,” “intends,” “expects,” “targets,” “is likely,” “will,” or the negative of these terms and similar expressions, and include all statements regarding future performance, earnings projections, events or developments. Parker cautions readers not to place undue reliance on these statements. It is possible that the future performance and earnings projections of the company, including its individual segments, may differ materially from current expectations, depending on economic conditions within its mobile, industrial and aerospace markets, and the company's ability to maintain and achieve anticipated benefits associated with announced realignment activities, strategic initiatives to improve operating margins, actions taken to combat the effects of the current economic environment, and growth, innovation and global diversification initiatives. Additionally, the actual impact of changes in tax laws in the United States and foreign jurisdictions and any judicial or regulatory interpretation thereof on future performance and earnings projections may impact the company’s tax calculations. A change in the economic conditions in individual markets may have a particularly volatile effect on segment performance. The risks and uncertainties in connection with such forward-looking statements related to the proposed acquisition of Meggitt include, but are not limited to, the occurrence of any event, change or other circumstances that could delay the closing of the acquisition; the possibility of nonconsummation of the acquisition; the failure to satisfy any of the conditions to the acquisition (including the satisfaction of the conditions detailed in the Rule 2.7 announcement); the possibility that a governmental entity may prohibit the consummation of the acquisition or may delay or refuse to grant a necessary regulatory approval in connection with the acquisition, or that in order for the parties to obtain any such regulatory approvals, conditions are imposed that adversely affect the anticipated benefits from the acquisition or cause the parties to abandon the acquisition; adverse effects on Parker’s common stock because of the failure to complete the acquisition; Parker’s business experiencing disruptions due to acquisition-related uncertainty or other factors making it more difficult to maintain relationships with employees, business partners or governmental entities; the possibility that the expected synergies and value creation from the acquisition will not be realized or will not be realized within the expected time period; the parties being unable to successfully implement integration strategies; and significant transaction costs related to the acquisition. Readers should consider these forward-looking statements in light of risk factors discussed in Parker’s Annual Report on Form 10-K for the fiscal year ended June 30, 2020 and other periodic filings made with the Securities and Exchange Commission. Among other factors which may affect future performance are: the impact of the global outbreak of COVID-19 and governmental and other actions taken in response; changes in business relationships with and purchases by or from major customers, suppliers or distributors, including delays or cancellations in shipments; disputes regarding contract terms or significant changes in financial condition, changes in contract cost and revenue estimates for new development programs and changes in product mix; ability to identify acceptable strategic acquisition targets; uncertainties surrounding timing, successful completion or integration of acquisitions and similar transactions, including the integration of LORD Corporation or Exotic Metals; the ability to successfully divest businesses planned for divestiture and realize the anticipated benefits of such divestitures; the determination to undertake business realignment activities and the expected costs thereof and, if undertaken, the ability to complete such activities and realize the anticipated cost savings from such activities; ability to implement successfully capital allocation initiatives, including timing, price and execution of share repurchases; availability, limitations or cost increases of raw materials, component products and/or commodities that cannot be recovered in product pricing; ability to manage costs related to insurance and employee retirement and health care benefits; compliance costs associated with environmental laws and regulations; potential labor disruptions; threats associated with and efforts to combat terrorism and cyber-security risks; uncertainties surrounding the ultimate resolution of outstanding legal proceedings, including the outcome of any appeals; global competitive market conditions, including global reactions to U.S. trade policies, and resulting effects on sales and pricing; and global economic factors, including manufacturing activity, air travel trends, currency exchange rates, difficulties entering new markets and general economic conditions such as inflation, deflation, interest rates and credit availability. The company makes these statements as of the date of this disclosure and undertakes no obligation to update them unless otherwise required by law. This presentation contains references to non-GAAP financial information for Parker, including organic sales for Parker and by segment, adjusted net income, adjusted earnings per share, adjusted operating margin for Parker and by segment, EBITDA, adjusted EBITDA, EBITDA margin, adjusted EBITDA margin and free cash flow. EBITDA is defined as earnings before interest, taxes, depreciation and amortization. For Parker, adjusted EBITDA is defined as EBITDA before business realignment, Integration costs to achieve, acquisition related expenses and gain on the sale of land. Free cash flow is defined as cash flow from operations less capital expenditures. Although organic sales, adjusted earnings per share, adjusted operating margin for Parker and by segment, EBITDA, adjusted EBITDA, EBITDA margin and free cash flow are not measures of performance calculated in accordance with GAAP, we believe that they are useful to an investor in evaluating the company performance for the period presented. Detailed reconciliations of these non-GAAP financial measures to the comparable GAAP financial measures have been included in the appendix to this presentation. Please visit www.PHstock.com for more information
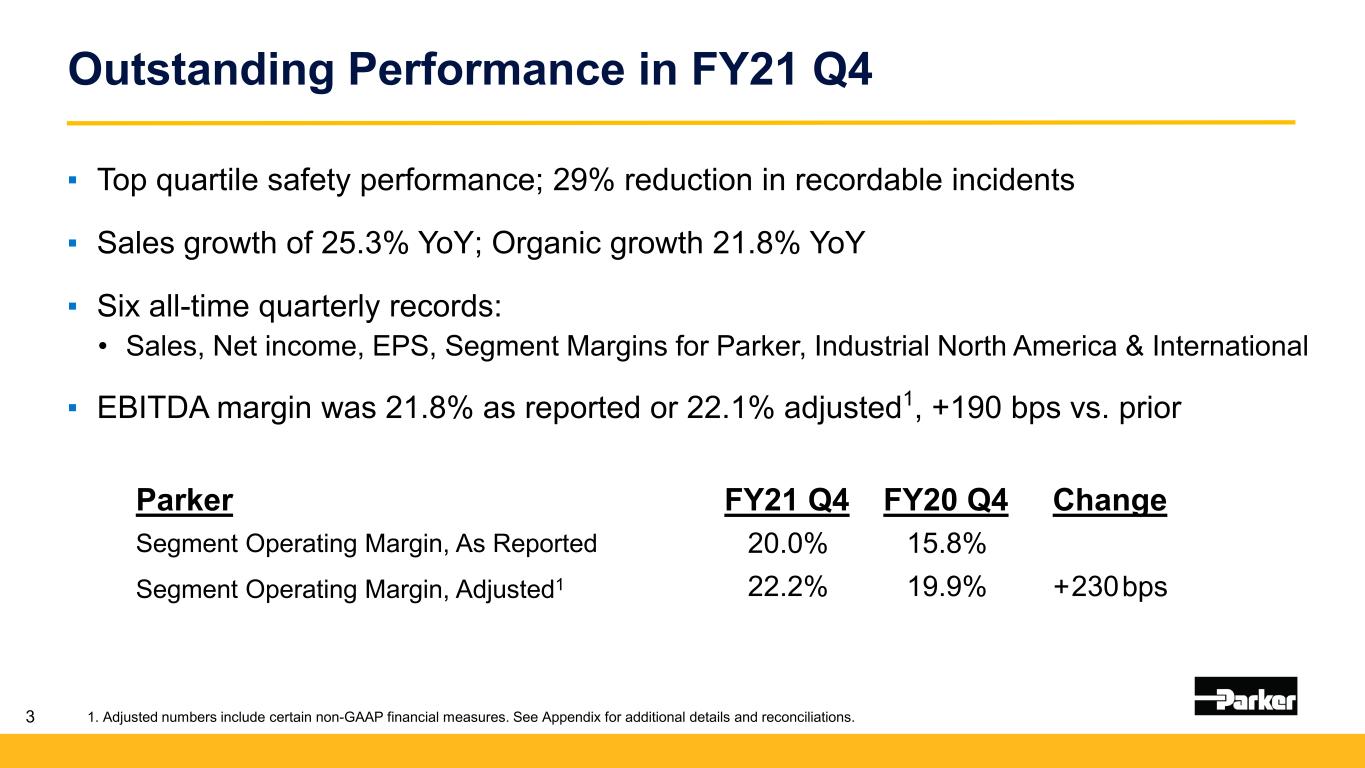
Outstanding Performance in FY21 Q4 3 ▪ Top quartile safety performance; 29% reduction in recordable incidents ▪ Sales growth of 25.3% YoY; Organic growth 21.8% YoY ▪ Six all-time quarterly records: • Sales, Net income, EPS, Segment Margins for Parker, Industrial North America & International ▪ EBITDA margin was 21.8% as reported or 22.1% adjusted1, +190 bps vs. prior Parker FY21 Q4 FY20 Q4 Change Segment Operating Margin, As Reported 20.0% 15.8% Segment Operating Margin, Adjusted1 22.2% 19.9% 230+ bps 1. Adjusted numbers include certain non-GAAP financial measures. See Appendix for additional details and reconciliations.
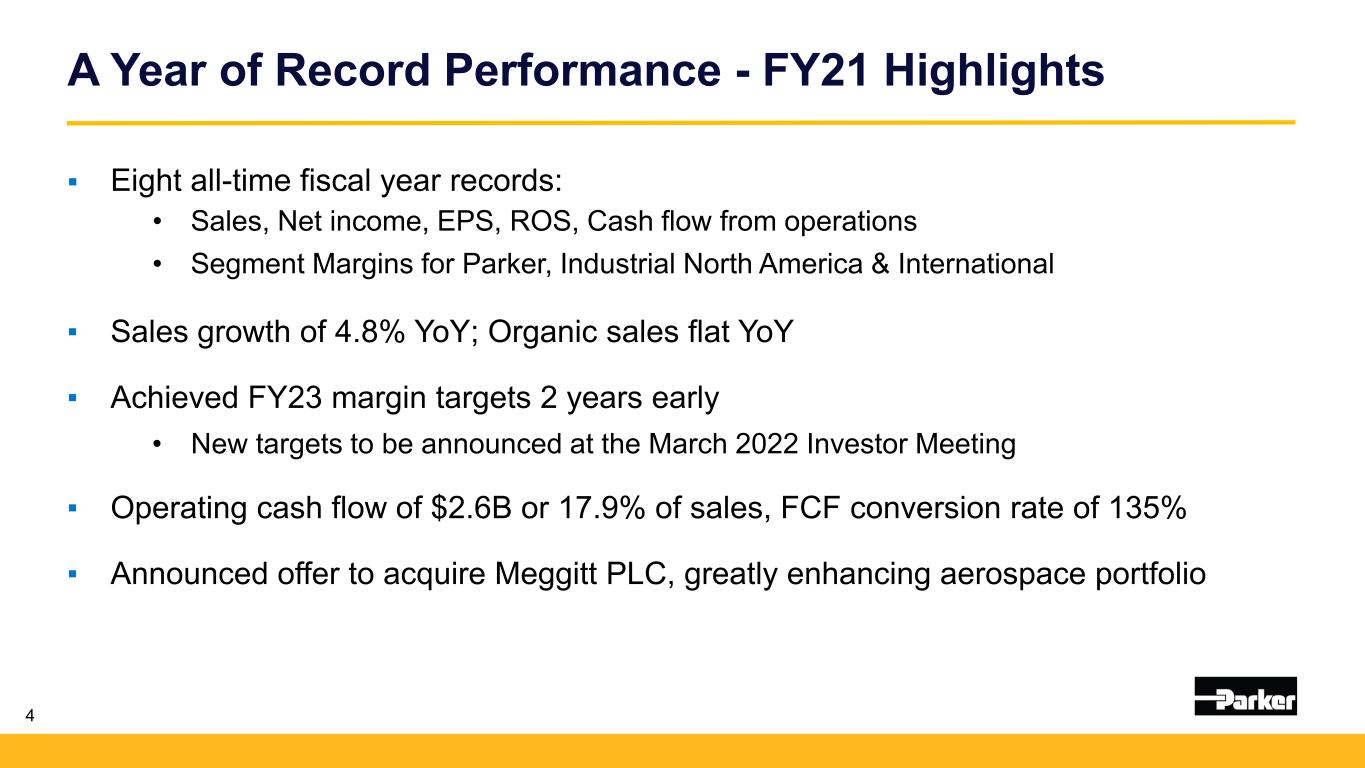
A Year of Record Performance - FY21 Highlights 4 Eight all-time fiscal year records: • Sales, Net income, EPS, ROS, Cash flow from operations • Segment Margins for Parker, Industrial North America & International ▪ Sales growth of 4.8% YoY; Organic sales flat YoY ▪ Achieved FY23 margin targets 2 years early • New targets to be announced at the March 2022 Investor Meeting ▪ Operating cash flow of $2.6B or 17.9% of sales, FCF conversion rate of 135% ▪ Announced offer to acquire Meggitt PLC, greatly enhancing aerospace portfolio

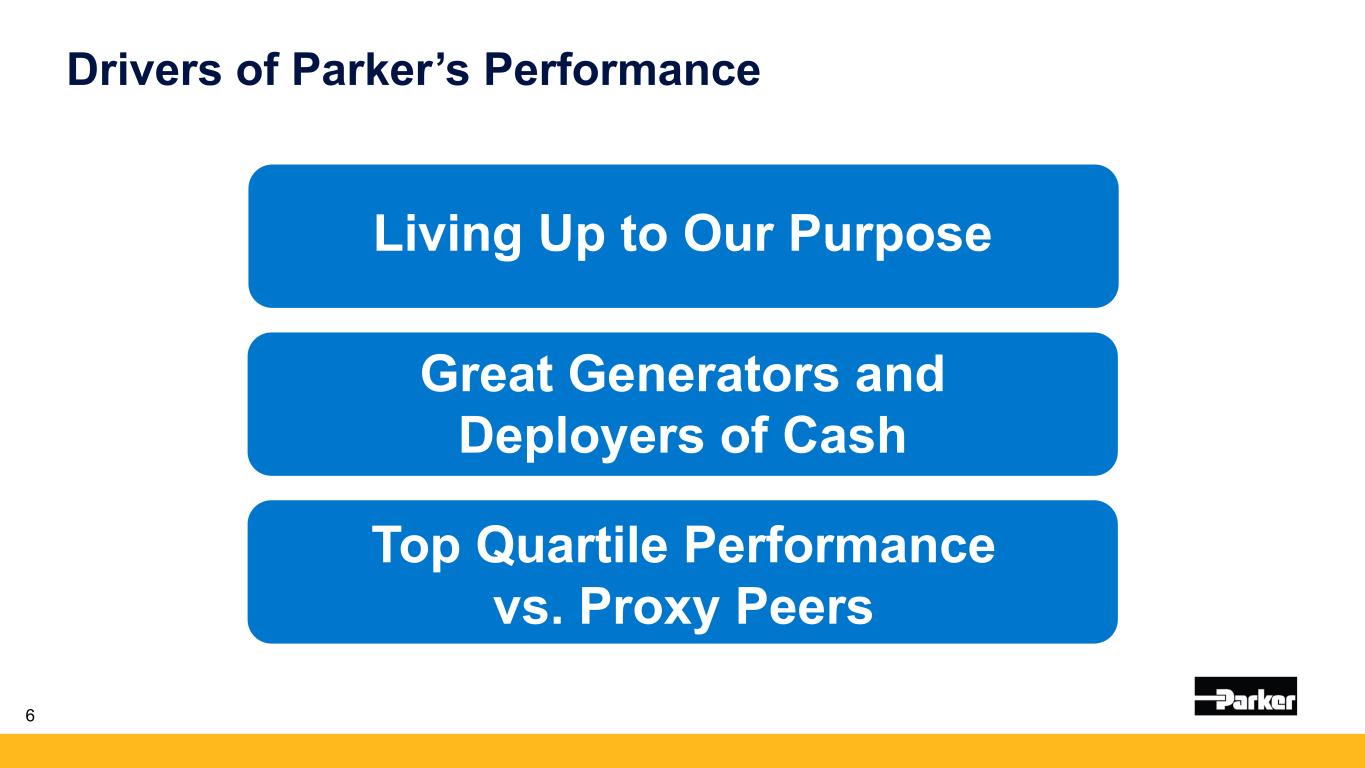
Drivers of Parker’s Performance Great Generators and Deployers of Cash Living Up to Our Purpose Top Quartile Performance vs. Proxy Peers 6
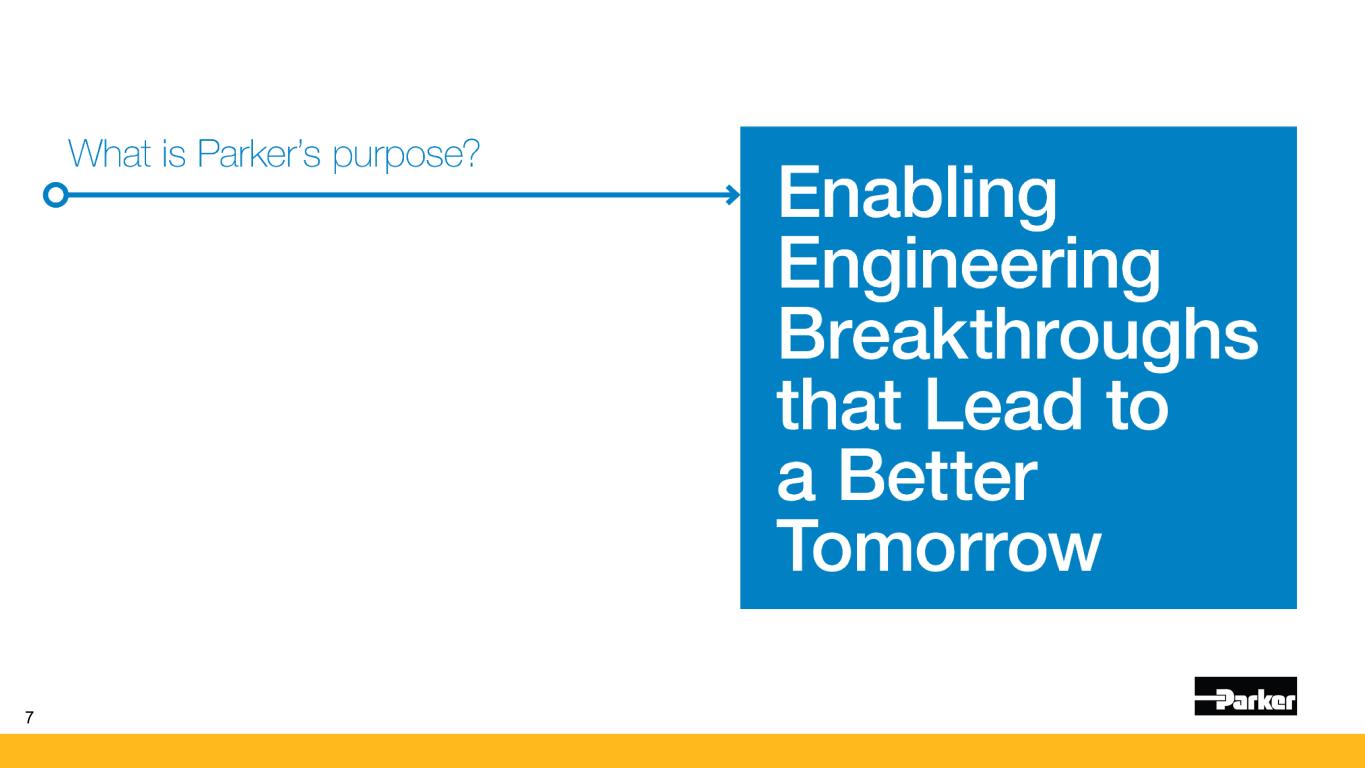
7
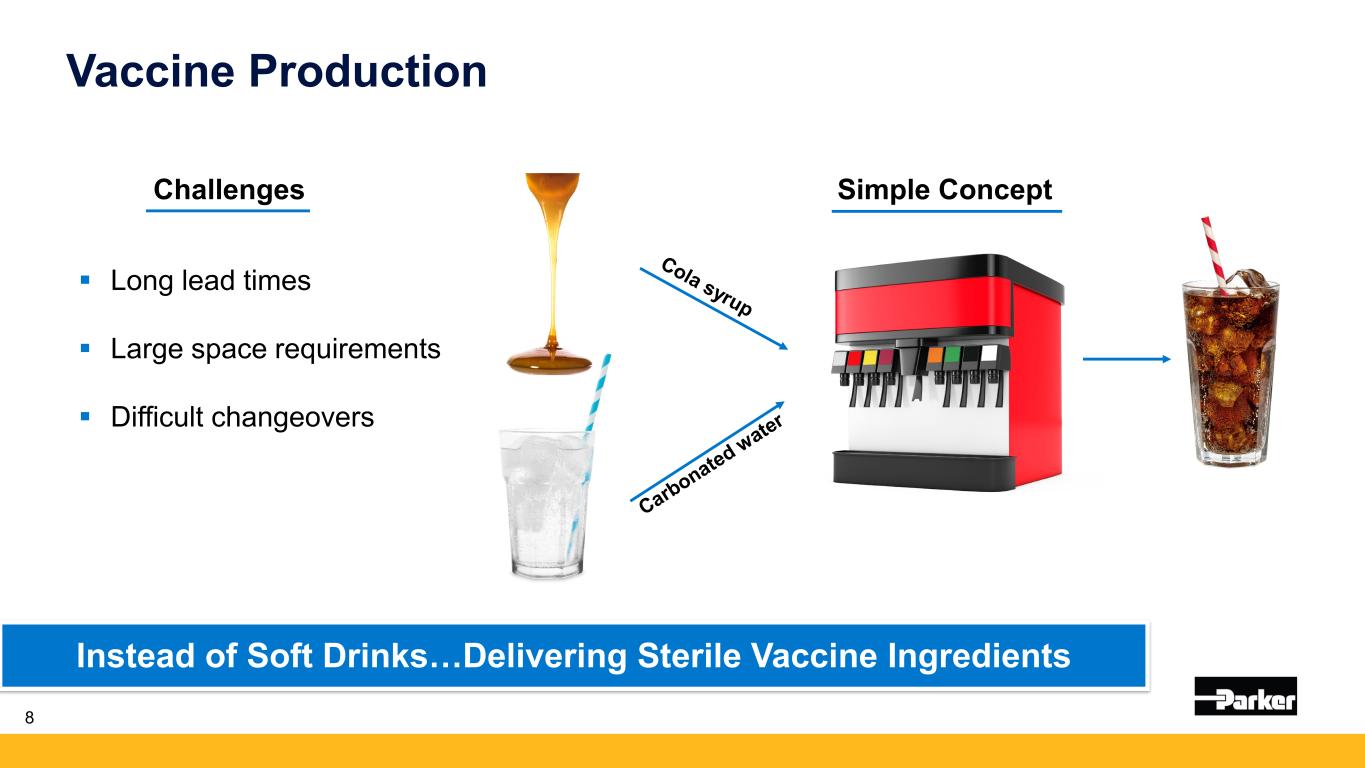
3 Vaccine Production 8 Instead of Soft Drinks…Delivering Sterile Vaccine Ingredients Long lead times Large space requirements Difficult changeovers Challenges Simple Concept
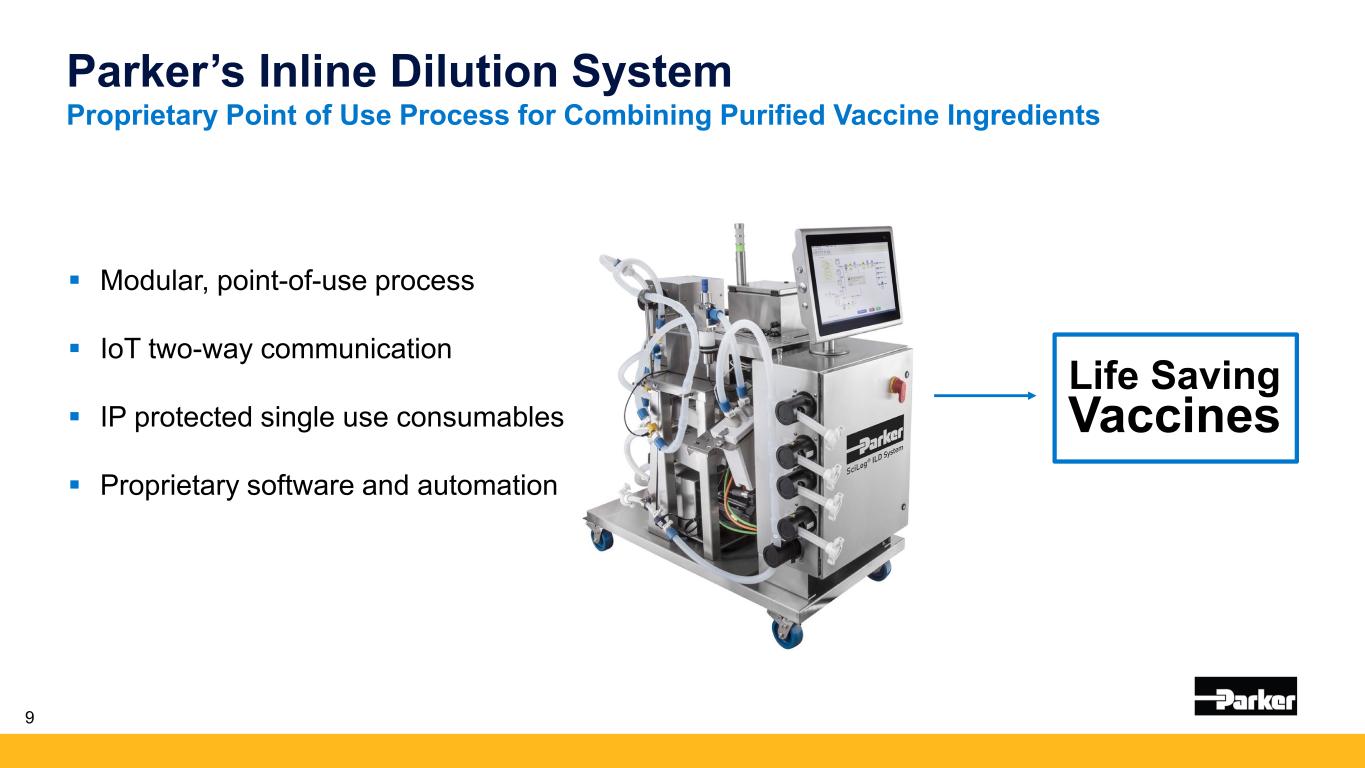
3 Parker’s Inline Dilution System Proprietary Point of Use Process for Combining Purified Vaccine Ingredients 9 Modular, point-of-use process IoT two-way communication IP protected single use consumables Proprietary software and automation Life Saving Vaccines

Sustainability Targets Announced July 2021 10 Enabling a More Sustainable Future
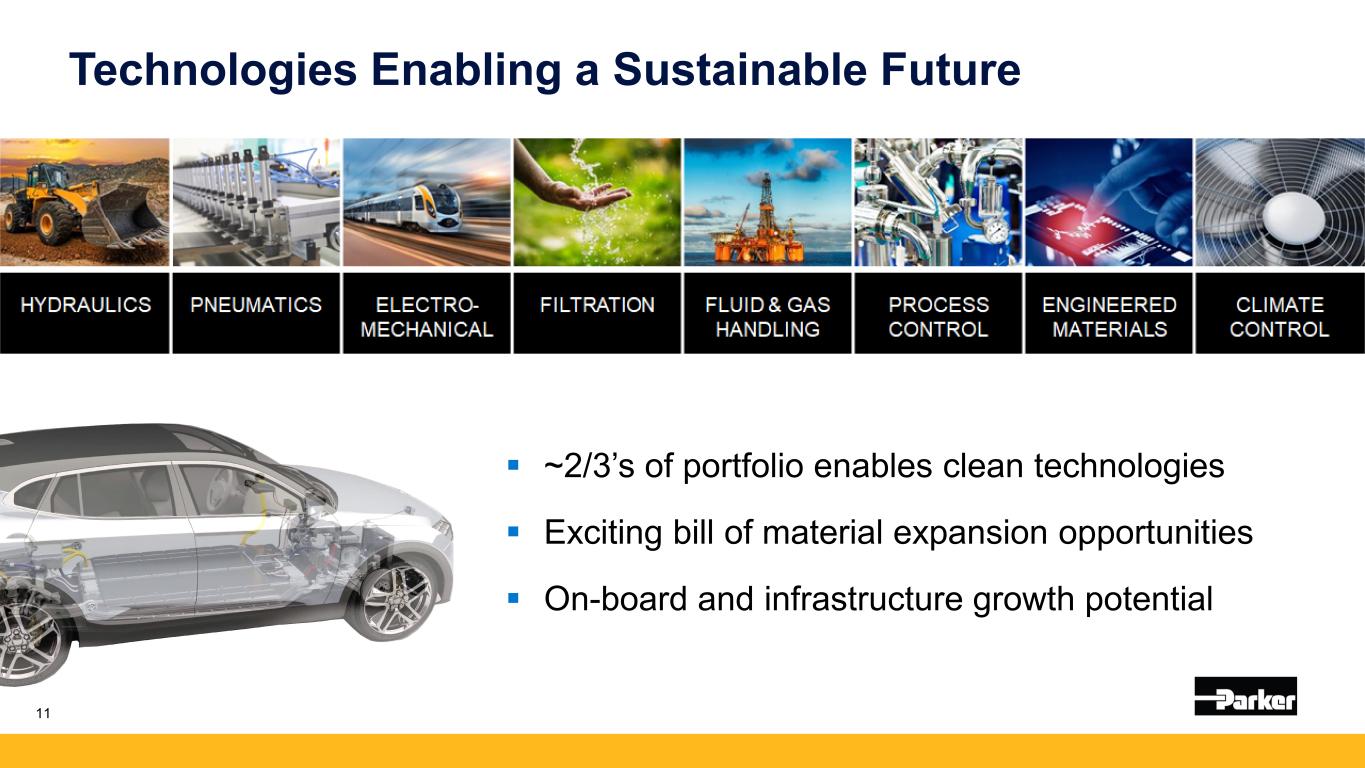
Technologies Enabling a Sustainable Future 11 ~2/3’s of portfolio enables clean technologies Exciting bill of material expansion opportunities On-board and infrastructure growth potential
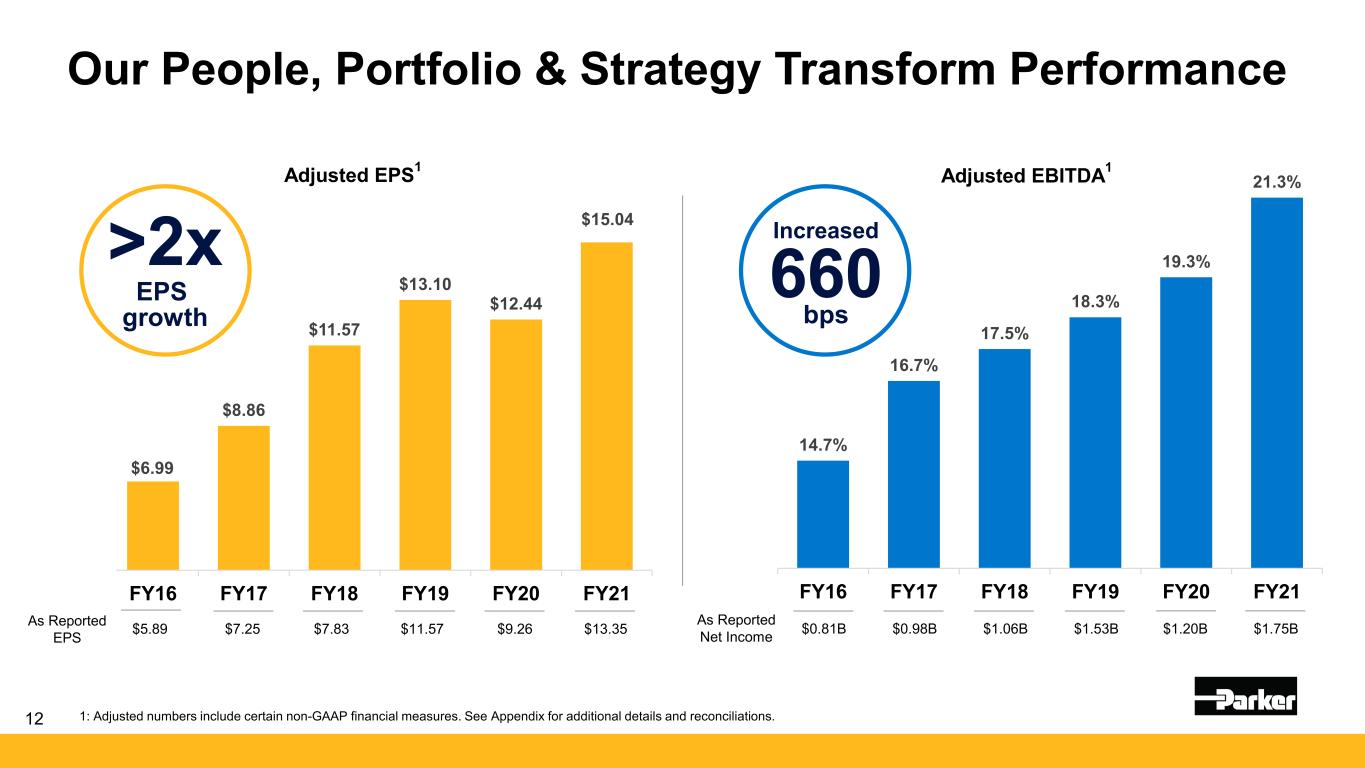
$6.99 $8.86 $11.57 $13.10 $12.44 $15.04 FY16 FY17 FY18 FY19 FY20 FY21 Adjusted EPS1 1: Adjusted numbers include certain non-GAAP financial measures. See Appendix for additional details and reconciliations. $5.89 $7.25 $7.83 $11.57 $9.26 $13.35As Reported EPS Our People, Portfolio & Strategy Transform Performance 14.7% 16.7% 17.5% 18.3% 19.3% 21.3% FY16 FY17 FY18 FY19 FY20 FY21 Adjusted EBITDA1 12 $0.81B $0.98B $1.06B $1.53B $1.20B $1.75BAs Reported Net Income >2x EPS growth Increased 660 bps
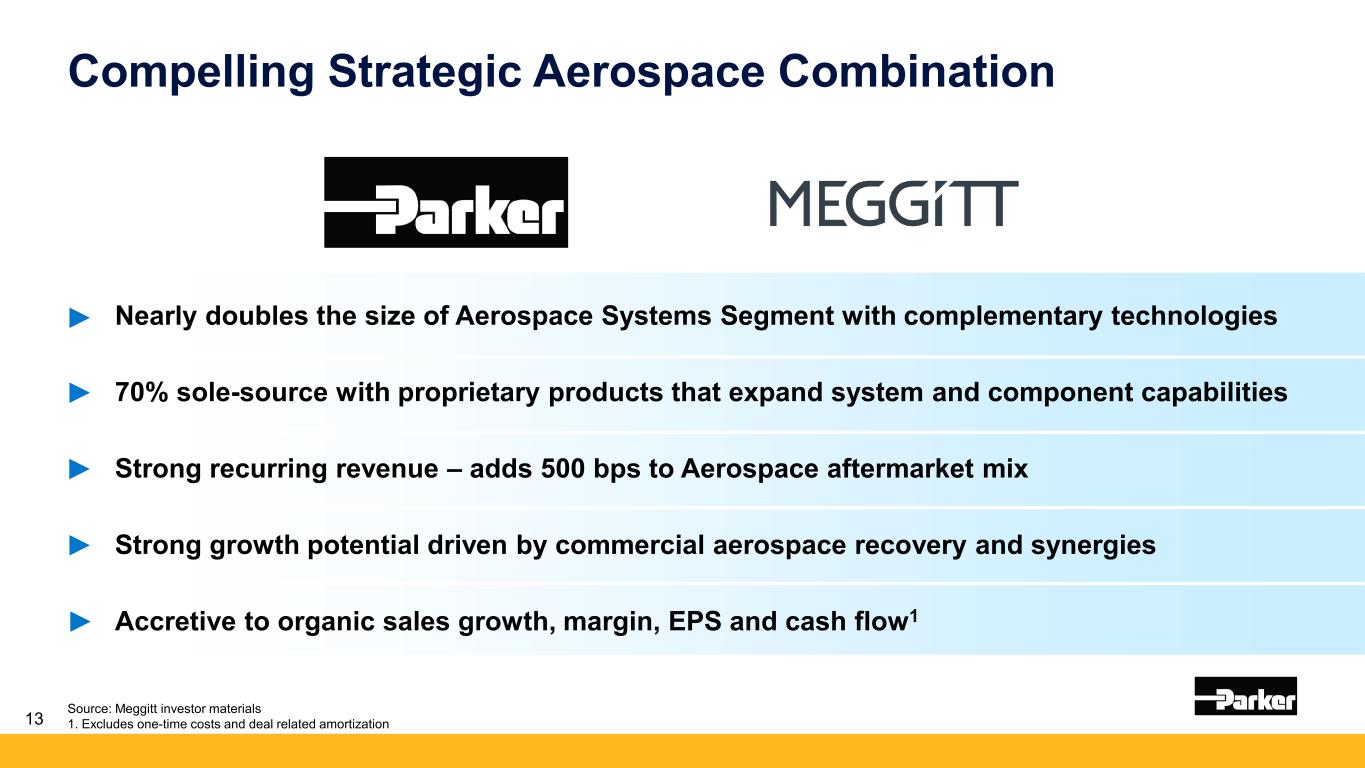
13 Compelling Strategic Aerospace Combination Nearly doubles the size of Aerospace Systems Segment with complementary technologies 70% sole-source with proprietary products that expand system and component capabilities Strong recurring revenue – adds 500 bps to Aerospace aftermarket mix Strong growth potential driven by commercial aerospace recovery and synergies Accretive to organic sales growth, margin, EPS and cash flow1 Source: Meggitt investor materials 1. Excludes one-time costs and deal related amortization

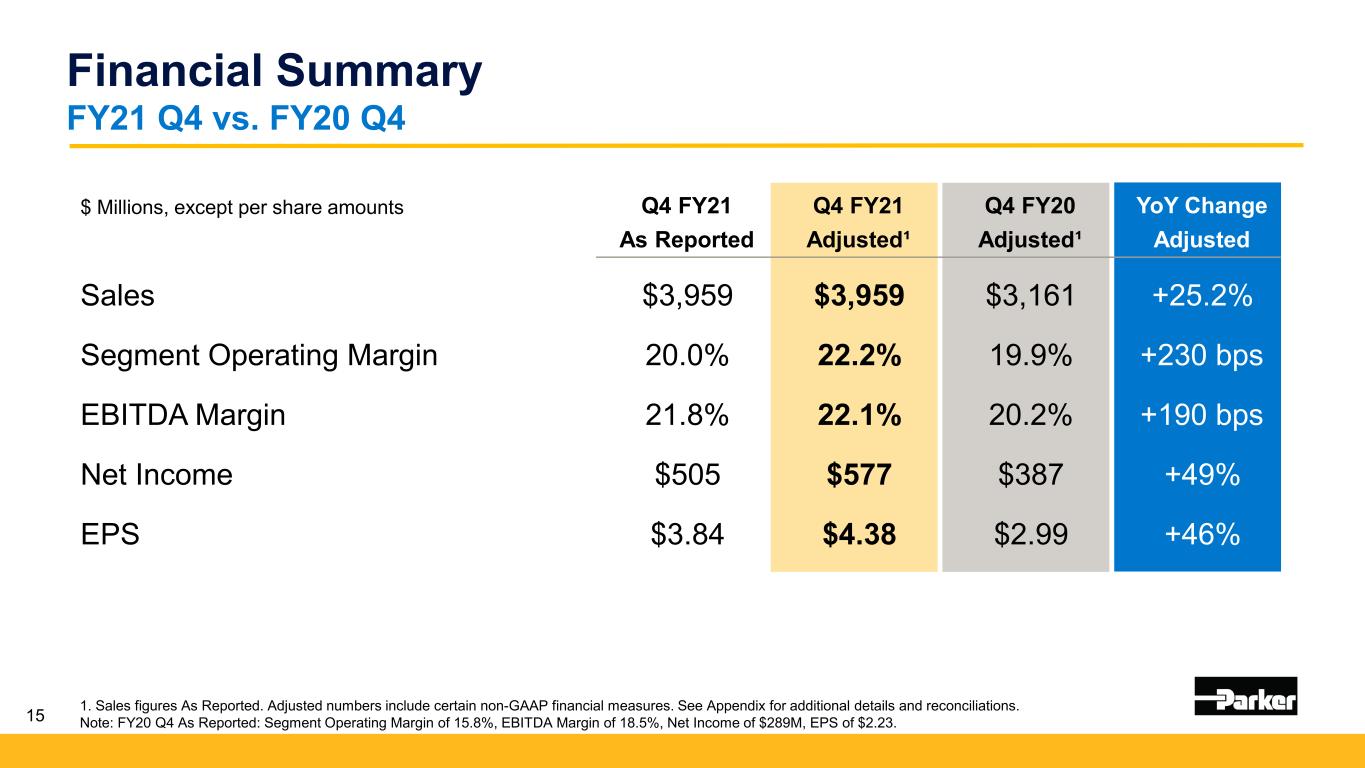
15 Financial Summary FY21 Q4 vs. FY20 Q4 1. Sales figures As Reported. Adjusted numbers include certain non-GAAP financial measures. See Appendix for additional details and reconciliations. Note: FY20 Q4 As Reported: Segment Operating Margin of 15.8%, EBITDA Margin of 18.5%, Net Income of $289M, EPS of $2.23. $ Millions, except per share amounts Q4 FY21 Q4 FY21 Q4 FY20 YoY Change As Reported Adjusted¹ Adjusted¹ Adjusted Sales $3,959 $3,959 $3,161 +25.2% Segment Operating Margin 20.0% 22.2% 19.9% +230 bps EBITDA Margin 21.8% 22.1% 20.2% +190 bps Net Income $505 $577 $387 +49% EPS $3.84 $4.38 $2.99 +46%
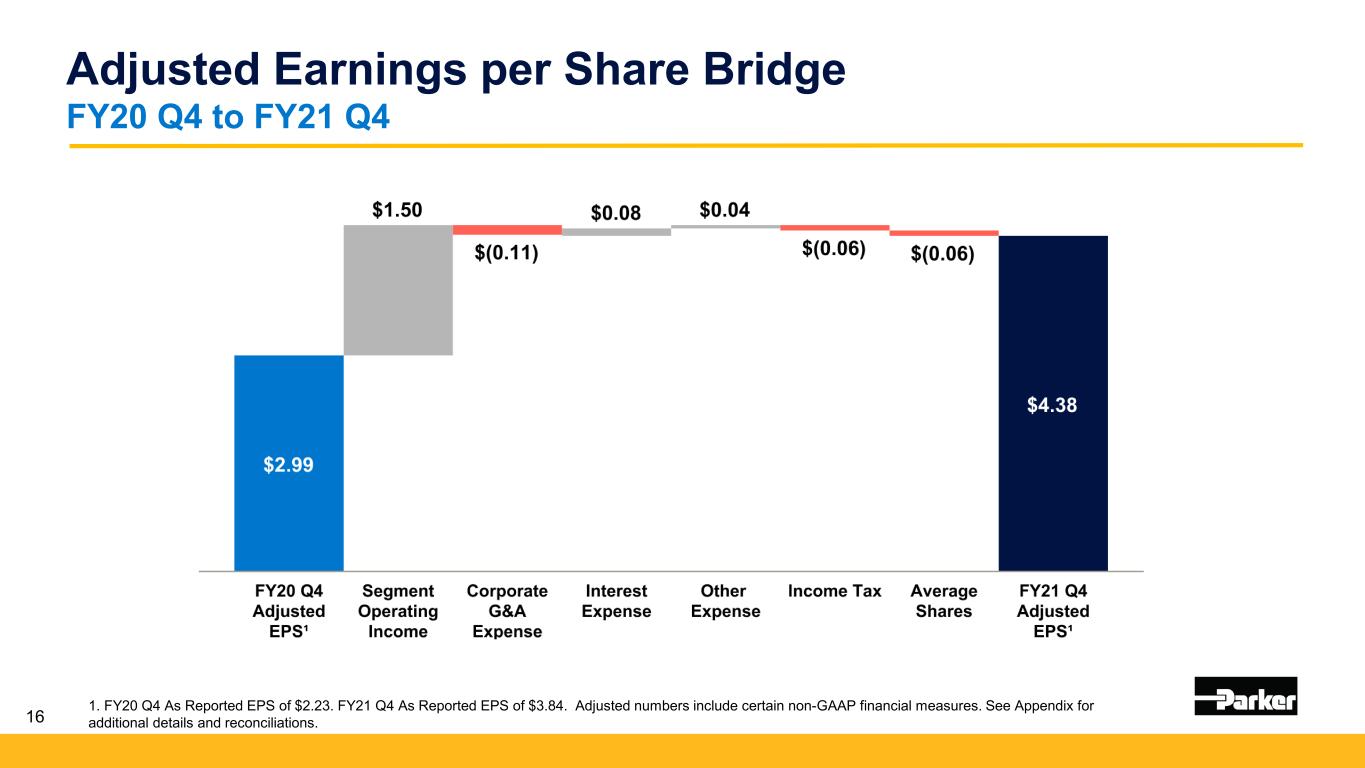
16 Adjusted Earnings per Share Bridge FY20 Q4 to FY21 Q4 1. FY20 Q4 As Reported EPS of $2.23. FY21 Q4 As Reported EPS of $3.84. Adjusted numbers include certain non-GAAP financial measures. See Appendix for additional details and reconciliations.
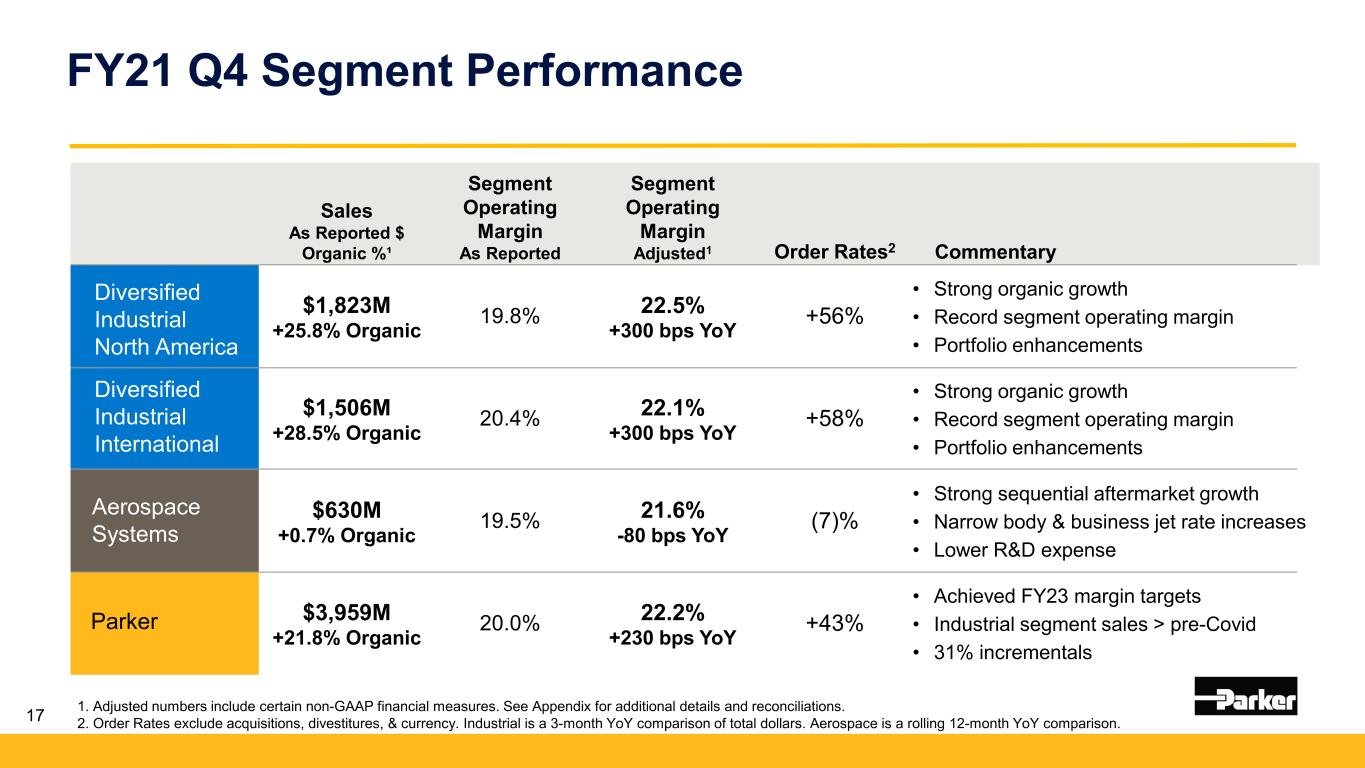
17 FY21 Q4 Segment Performance Sales As Reported $ Organic %¹ Segment Operating Margin As Reported Segment Operating Margin Adjusted1 Order Rates2 Commentary $1,823M +25.8% Organic 19.8% 22.5% +300 bps YoY +56% • Strong organic growth • Record segment operating margin • Portfolio enhancements $1,506M +28.5% Organic 20.4% 22.1% +300 bps YoY +58% • Strong organic growth • Record segment operating margin • Portfolio enhancements $630M +0.7% Organic 19.5% 21.6% -80 bps YoY (7)% • Strong sequential aftermarket growth • Narrow body & business jet rate increases • Lower R&D expense $3,959M +21.8% Organic 20.0% 22.2% +230 bps YoY +43% • Achieved FY23 margin targets • Industrial segment sales > pre-Covid • 31% incrementals 1. Adjusted numbers include certain non-GAAP financial measures. See Appendix for additional details and reconciliations. 2. Order Rates exclude acquisitions, divestitures, & currency. Industrial is a 3-month YoY comparison of total dollars. Aerospace is a rolling 12-month YoY comparison. Diversified Industrial International Diversified Industrial North America Parker Aerospace Systems
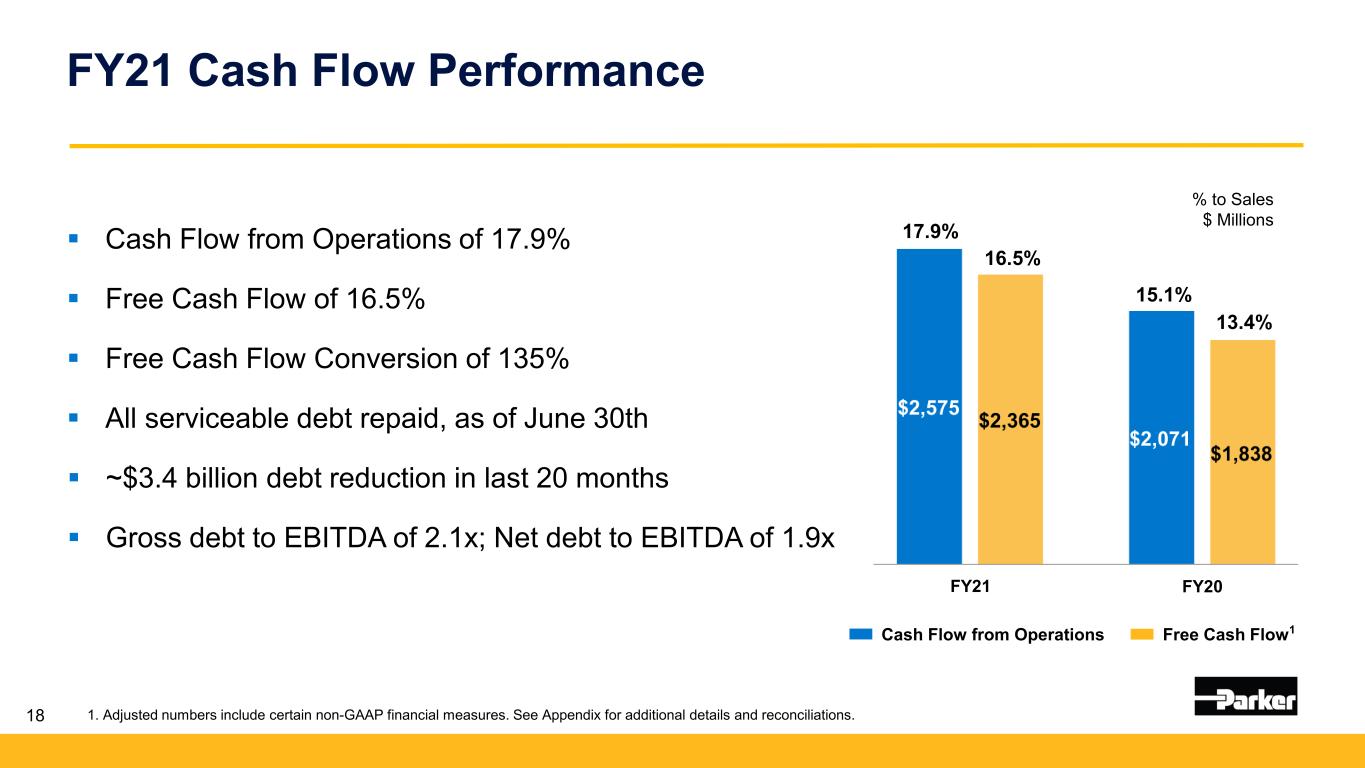
18 FY21 Cash Flow Performance Cash Flow from Operations of 17.9% Free Cash Flow of 16.5% Free Cash Flow Conversion of 135% All serviceable debt repaid, as of June 30th ~$3.4 billion debt reduction in last 20 months Gross debt to EBITDA of 2.1x; Net debt to EBITDA of 1.9x 1. Adjusted numbers include certain non-GAAP financial measures. See Appendix for additional details and reconciliations. % to Sales $ Millions17.9% 16.5% 15.1% 13.4% Cash Flow from Operations Free Cash Flow1 FY21 FY20
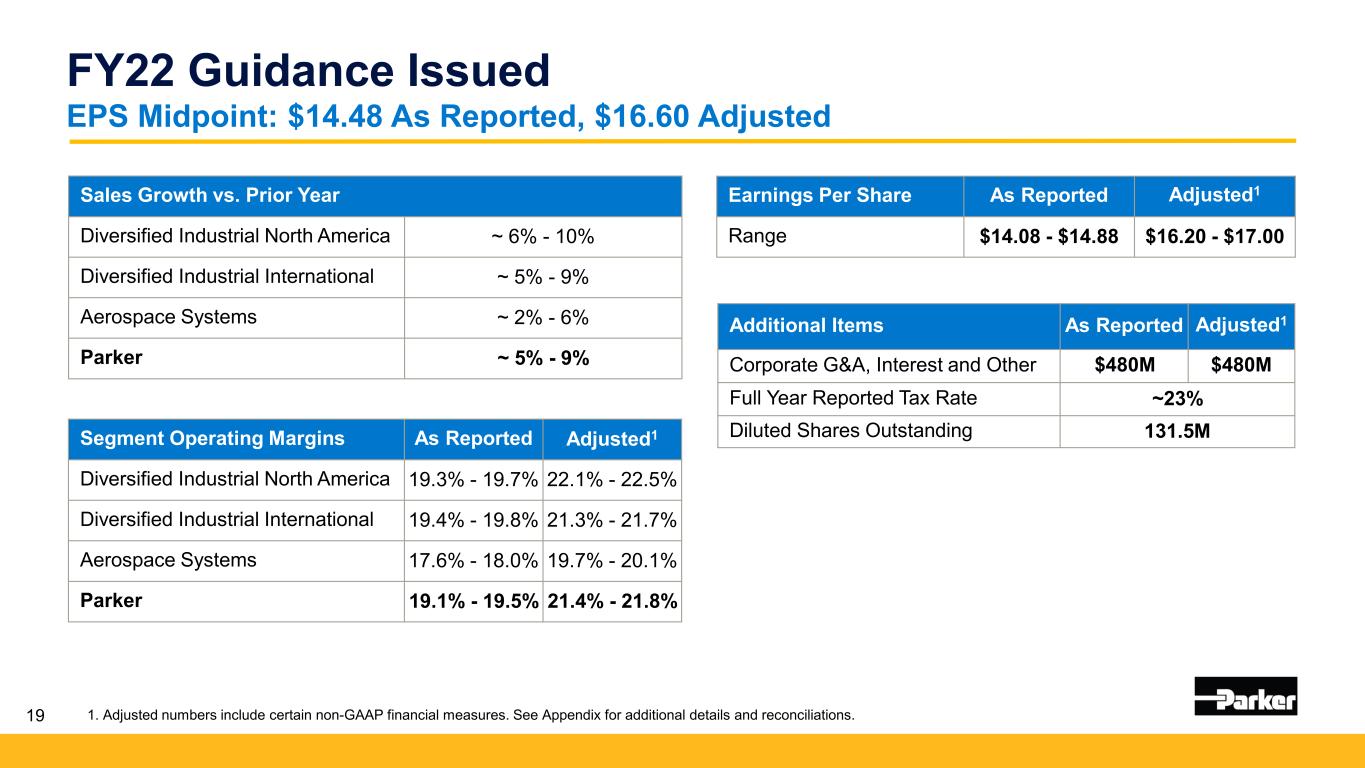
19 FY22 Guidance Issued EPS Midpoint: $14.48 As Reported, $16.60 Adjusted Sales Growth vs. Prior Year Diversified Industrial North America ~ 6% - 10% Diversified Industrial International ~ 5% - 9% Aerospace Systems ~ 2% - 6% Parker ~ 5% - 9% Segment Operating Margins As Reported Adjusted1 Diversified Industrial North America 19.3% - 19.7% 22.1% - 22.5% Diversified Industrial International 19.4% - 19.8% 21.3% - 21.7% Aerospace Systems 17.6% - 18.0% 19.7% - 20.1% Parker 19.1% - 19.5% 21.4% - 21.8% Additional Items As Reported Adjusted1 Corporate G&A, Interest and Other $480M $480M Full Year Reported Tax Rate ~23% Diluted Shares Outstanding 131.5M Earnings Per Share As Reported Adjusted1 Range $14.08 - $14.88 $16.20 - $17.00 1. Adjusted numbers include certain non-GAAP financial measures. See Appendix for additional details and reconciliations.
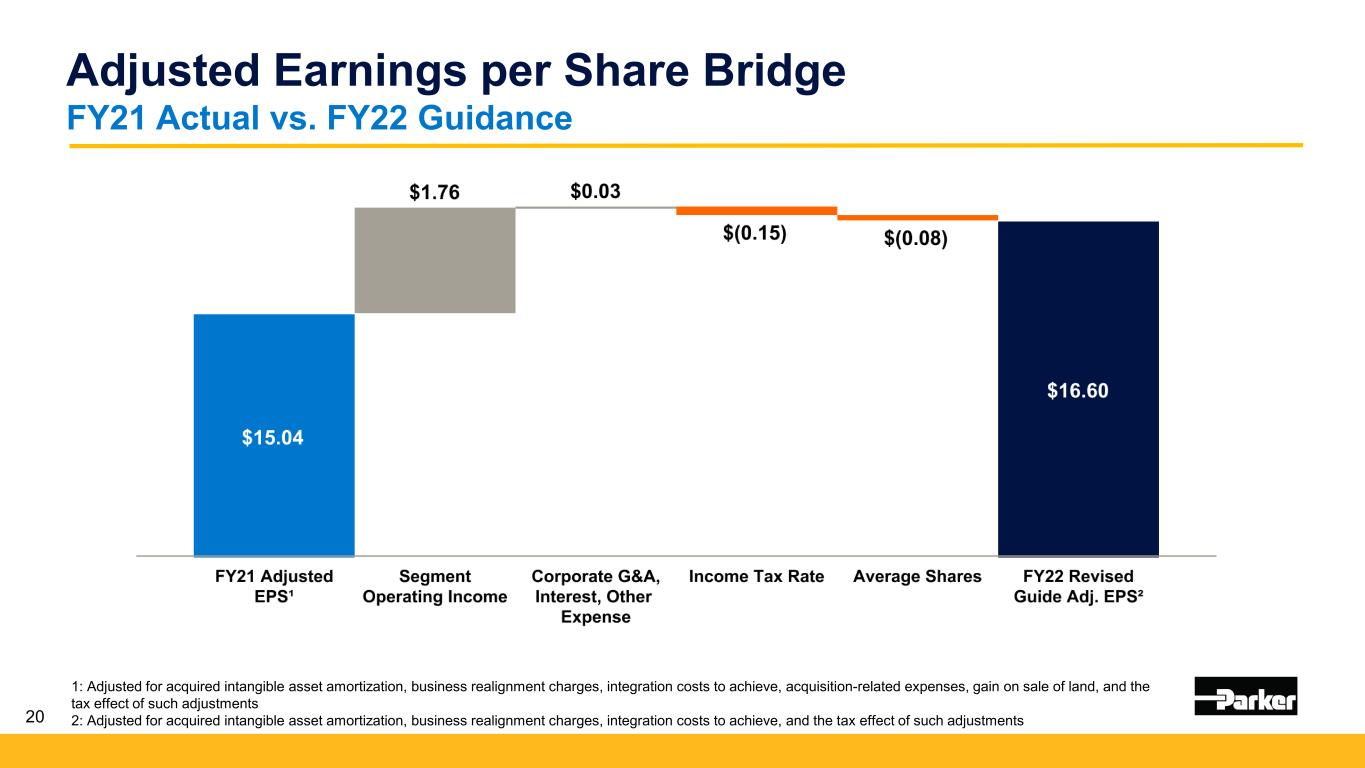
20 Adjusted Earnings per Share Bridge FY21 Actual vs. FY22 Guidance 1: Adjusted for acquired intangible asset amortization, business realignment charges, integration costs to achieve, acquisition-related expenses, gain on sale of land, and the tax effect of such adjustments 2: Adjusted for acquired intangible asset amortization, business realignment charges, integration costs to achieve, and the tax effect of such adjustments
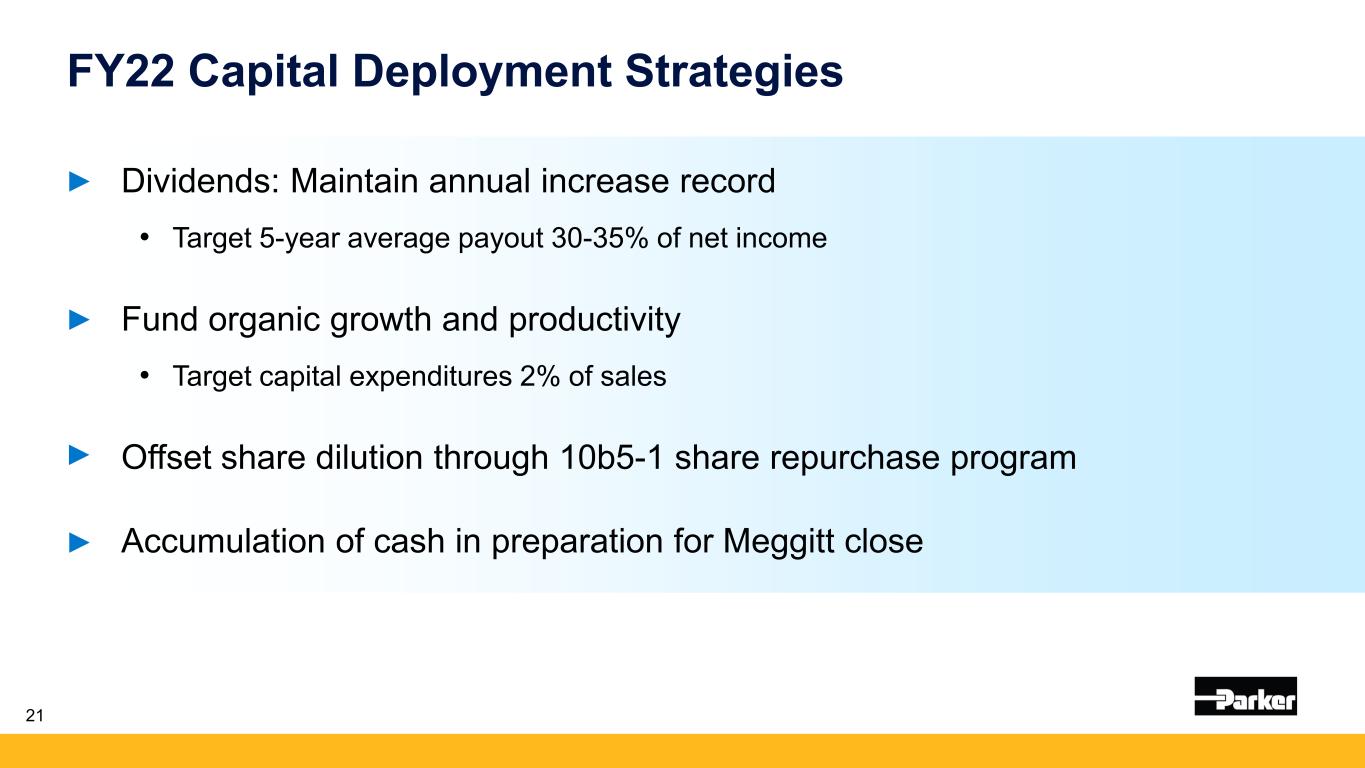
FY22 Capital Deployment Strategies Dividends: Maintain annual increase record • Target 5-year average payout 30-35% of net income Fund organic growth and productivity • Target capital expenditures 2% of sales Offset share dilution through 10b5-1 share repurchase program Accumulation of cash in preparation for Meggitt close 21
Key Messages Highly engaged global team Living up to our Purpose Top quartile performance Achieved FY23 margin targets 2 years early Strategic portfolio transformation 22 The Win Strategy 3.0 & Capital Deployment Accelerate Performance

Appendix • Reconciliation of Organic Growth • Adjusted Amounts Reconciliation • Reconciliation of EPS • Reconciliation of Total Segment Operating Margin to Adjusted Total Segment Operating Margin • Reconciliation of EBITDA to Adjusted EBITDA • Reconciliation of Free Cash Flow Conversion • Supplemental Sales Information – Global Technology Platforms • Reconciliation of Forecasted EPS 24
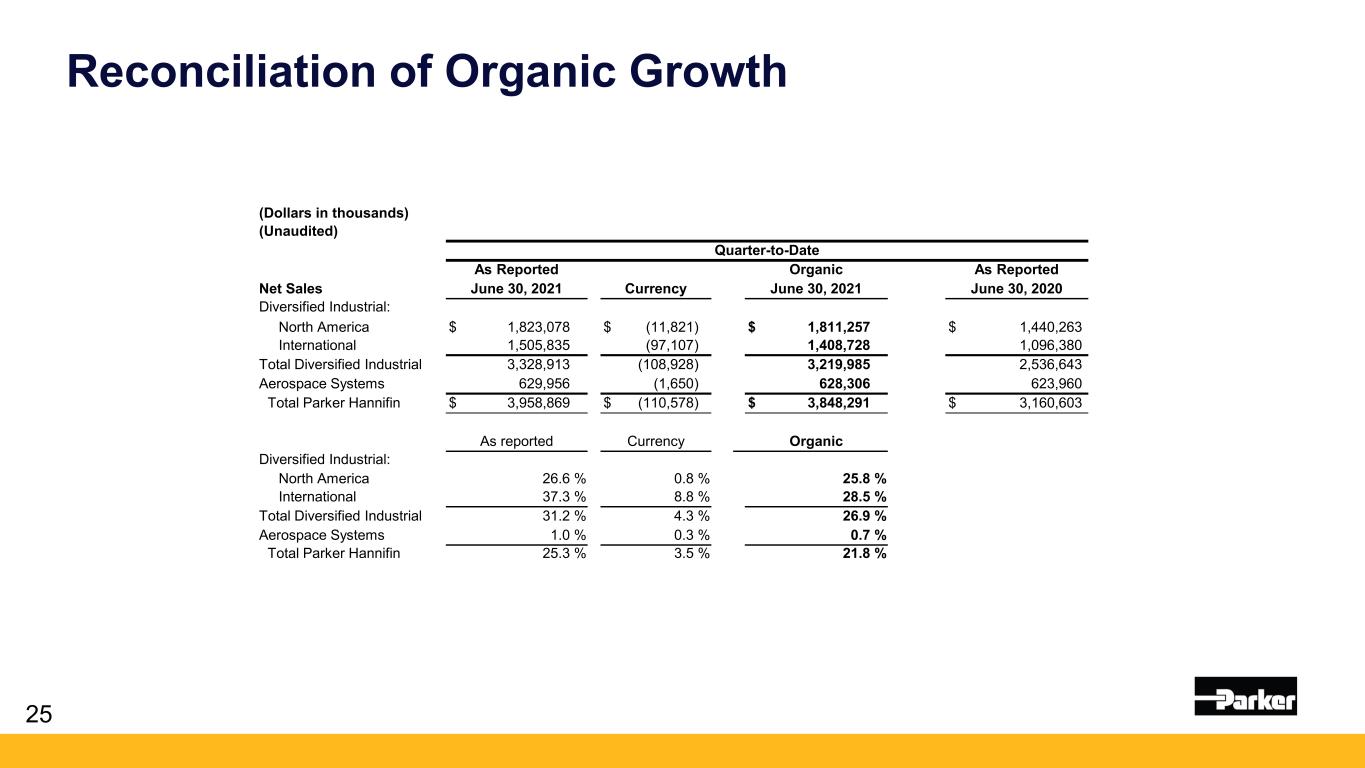
Reconciliation of Organic Growth 25 (Dollars in thousands) (Unaudited) Quarter-to-Date As Reported Currency Organic As Reported Net Sales June 30, 2021 June 30, 2021 June 30, 2020 Diversified Industrial: North America $ 1,823,078 $ (11,821) $ 1,811,257 $ 1,440,263 International 1,505,835 (97,107) 1,408,728 1,096,380 Total Diversified Industrial 3,328,913 (108,928) 3,219,985 2,536,643 Aerospace Systems 629,956 (1,650) 628,306 623,960 Total Parker Hannifin $ 3,958,869 $ (110,578) $ 3,848,291 $ 3,160,603 As reported Currency Organic Diversified Industrial: North America 26.6 % 0.8 % 25.8 % International 37.3 % 8.8 % 28.5 % Total Diversified Industrial 31.2 % 4.3 % 26.9 % Aerospace Systems 1.0 % 0.3 % 0.7 % Total Parker Hannifin 25.3 % 3.5 % 21.8 %
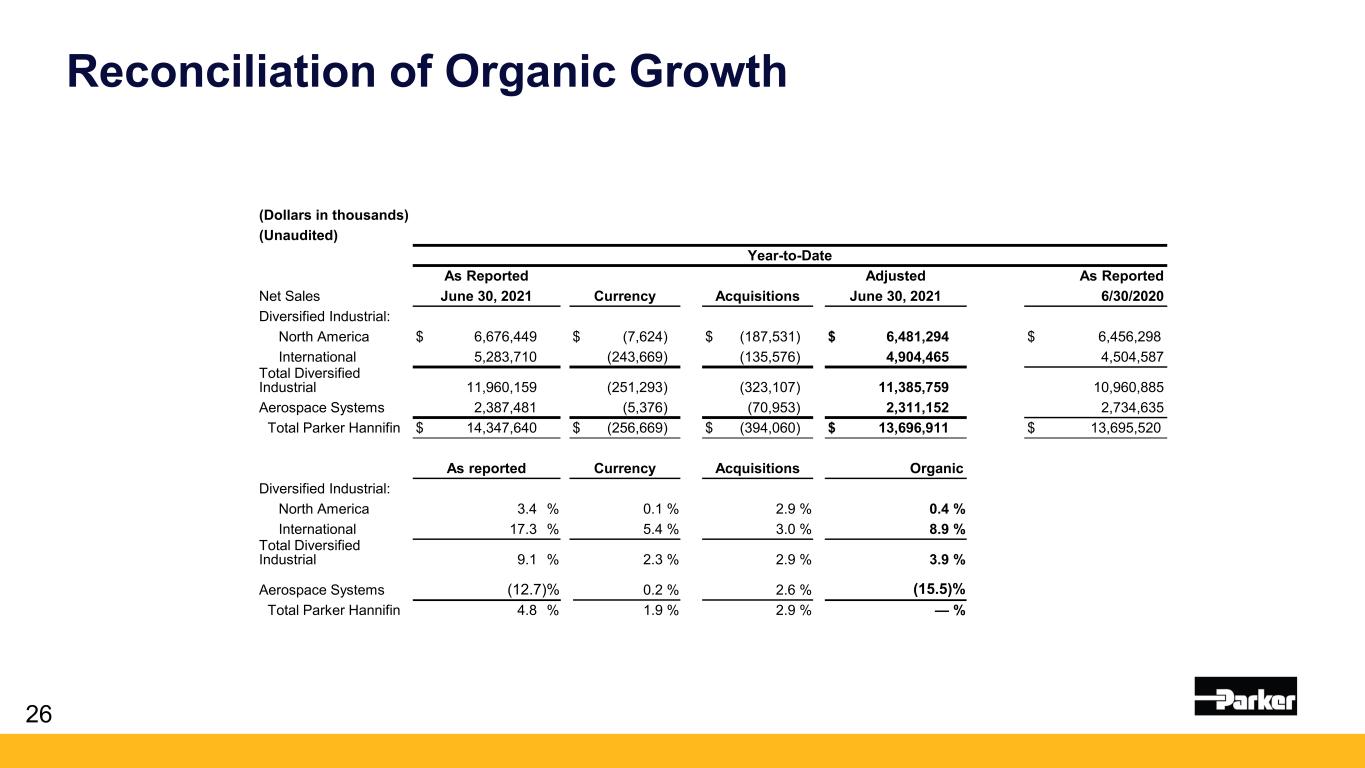
Reconciliation of Organic Growth 26 (Dollars in thousands) (Unaudited) Year-to-Date As Reported Currency Adjusted As Reported Net Sales June 30, 2021 Acquisitions June 30, 2021 6/30/2020 Diversified Industrial: North America $ 6,676,449 $ (7,624) $ (187,531) $ 6,481,294 $ 6,456,298 International 5,283,710 (243,669) (135,576) 4,904,465 4,504,587 Total Diversified Industrial 11,960,159 (251,293) (323,107) 11,385,759 10,960,885 Aerospace Systems 2,387,481 (5,376) (70,953) 2,311,152 2,734,635 Total Parker Hannifin $ 14,347,640 $ (256,669) $ (394,060) $ 13,696,911 $ 13,695,520 As reported Currency Acquisitions Organic Diversified Industrial: North America 3.4 % 0.1 % 2.9 % 0.4 % International 17.3 % 5.4 % 3.0 % 8.9 % Total Diversified Industrial 9.1 % 2.3 % 2.9 % 3.9 % Aerospace Systems (12.7)% 0.2 % 2.6 % (15.5 ) % Total Parker Hannifin 4.8 % 1.9 % 2.9 % — % (12.7)% (15. )
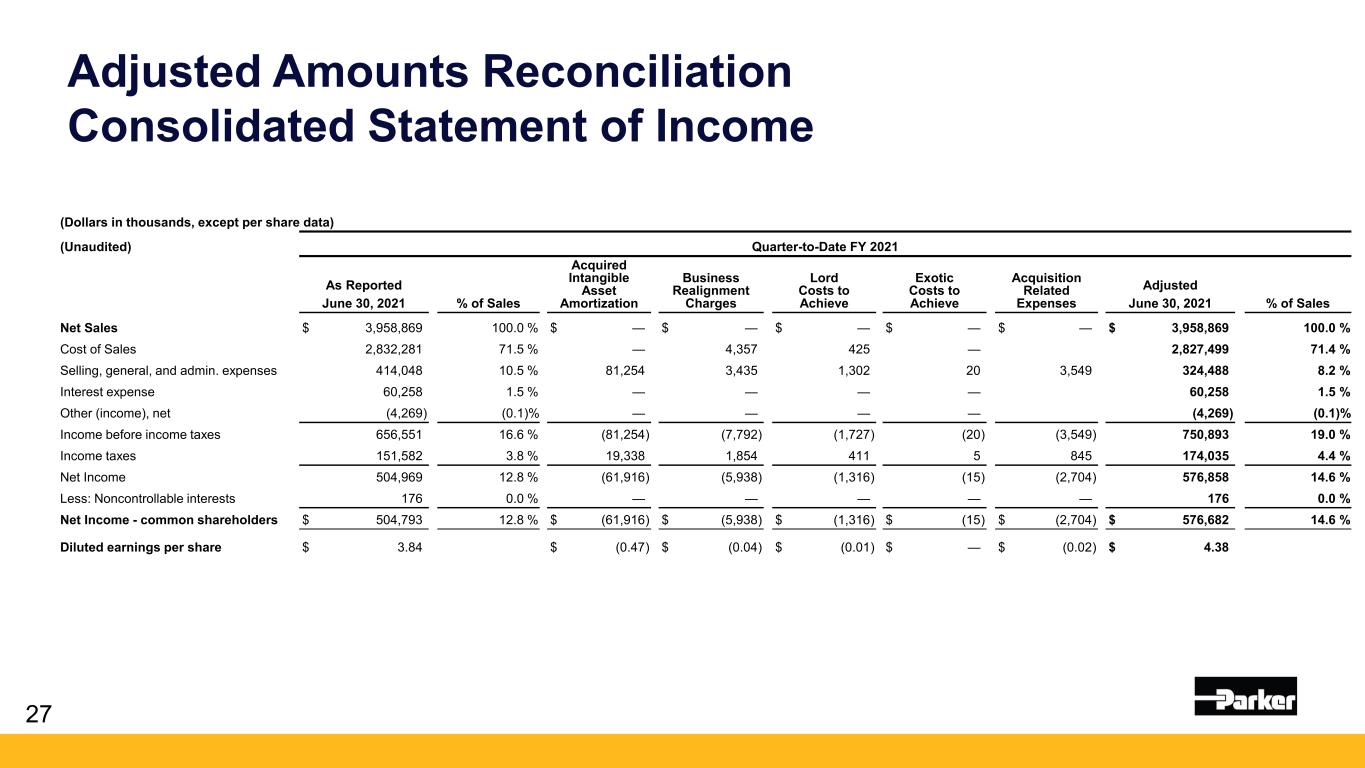
Adjusted Amounts Reconciliation Consolidated Statement of Income 27 (Dollars in thousands, except per share data) (Unaudited) Quarter-to-Date FY 2021 % of Sales Acquired Intangible Asset Amortization Business Realignment Charges Lord Costs to Achieve Exotic Costs to Achieve Acquisition Related Expenses % of Sales As Reported Adjusted June 30, 2021 June 30, 2021 Net Sales $ 3,958,869 100.0 % $ — $ — $ — $ — $ — $ 3,958,869 100.0 % Cost of Sales 2,832,281 71.5 % — 4,357 425 — 2,827,499 71.4 % Selling, general, and admin. expenses 414,048 10.5 % 81,254 3,435 1,302 20 3,549 324,488 8.2 % Interest expense 60,258 1.5 % — — — — 60,258 1.5 % Other (income), net (4,269) (0.1)% — — — — (4,269) (0.1)% Income before income taxes 656,551 16.6 % (81,254) (7,792) (1,727) (20) (3,549) 750,893 19.0 % Income taxes 151,582 3.8 % 19,338 1,854 411 5 845 174,035 4.4 % Net Income 504,969 12.8 % (61,916) (5,938) (1,316) (15) (2,704) 576,858 14.6 % Less: Noncontrollable interests 176 0.0 % — — — — — 176 0.0 % Net Income - common shareholders $ 504,793 12.8 % $ (61,916) $ (5,938) $ (1,316) $ (15) $ (2,704) $ 576,682 14.6 % Diluted earnings per share $ 3.84 $ (0.47) $ (0.04) $ (0.01) $ — $ (0.02) $ 4.38
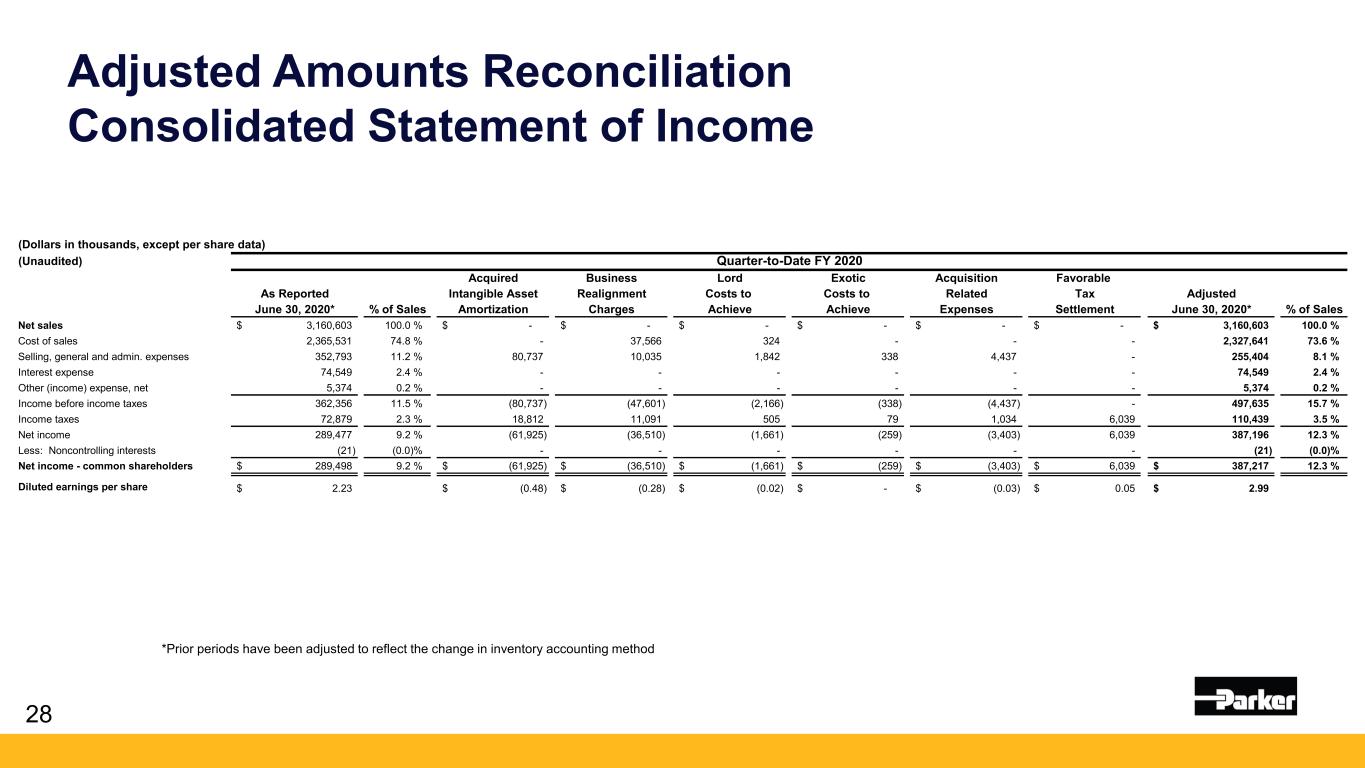
Adjusted Amounts Reconciliation Consolidated Statement of Income 28 *Prior periods have been adjusted to reflect the change in inventory accounting method (Dollars in thousands, except per share data) (Unaudited) Quarter-to-Date FY 2020 Acquired Business Lord Exotic Acquisition Favorable As Reported Intangible Asset Realignment Costs to Costs to Related Tax Adjusted June 30, 2020* % of Sales Amortization Charges Achieve Achieve Expenses Settlement June 30, 2020* % of Sales Net sales 3,160,603$ 100.0 % -$ -$ -$ -$ -$ -$ 3,160,603$ 100.0 % Cost of sales 2,365,531 74.8 % - 37,566 324 - - - 2,327,641 73.6 % Selling, general and admin. expenses 352,793 11.2 % 80,737 10,035 1,842 338 4,437 - 255,404 8.1 % Interest expense 74,549 2.4 % - - - - - - 74,549 2.4 % Other (income) expense, net 5,374 0.2 % - - - - - - 5,374 0.2 % Income before income taxes 362,356 11.5 % (80,737) (47,601) (2,166) (338) (4,437) - 497,635 15.7 % Income taxes 72,879 2.3 % 18,812 11,091 505 79 1,034 6,039 110,439 3.5 % Net income 289,477 9.2 % (61,925) (36,510) (1,661) (259) (3,403) 6,039 387,196 12.3 % Less: Noncontrolling interests (21) (0.0)% - - - - - - (21) (0.0)% Net income - common shareholders 289,498$ 9.2 % (61,925)$ (36,510)$ (1,661)$ (259)$ (3,403)$ 6,039$ 387,217$ 12.3 % Diluted earnings per share 2.23$ (0.48)$ (0.28)$ (0.02)$ -$ (0.03)$ 0.05$ 2.99$
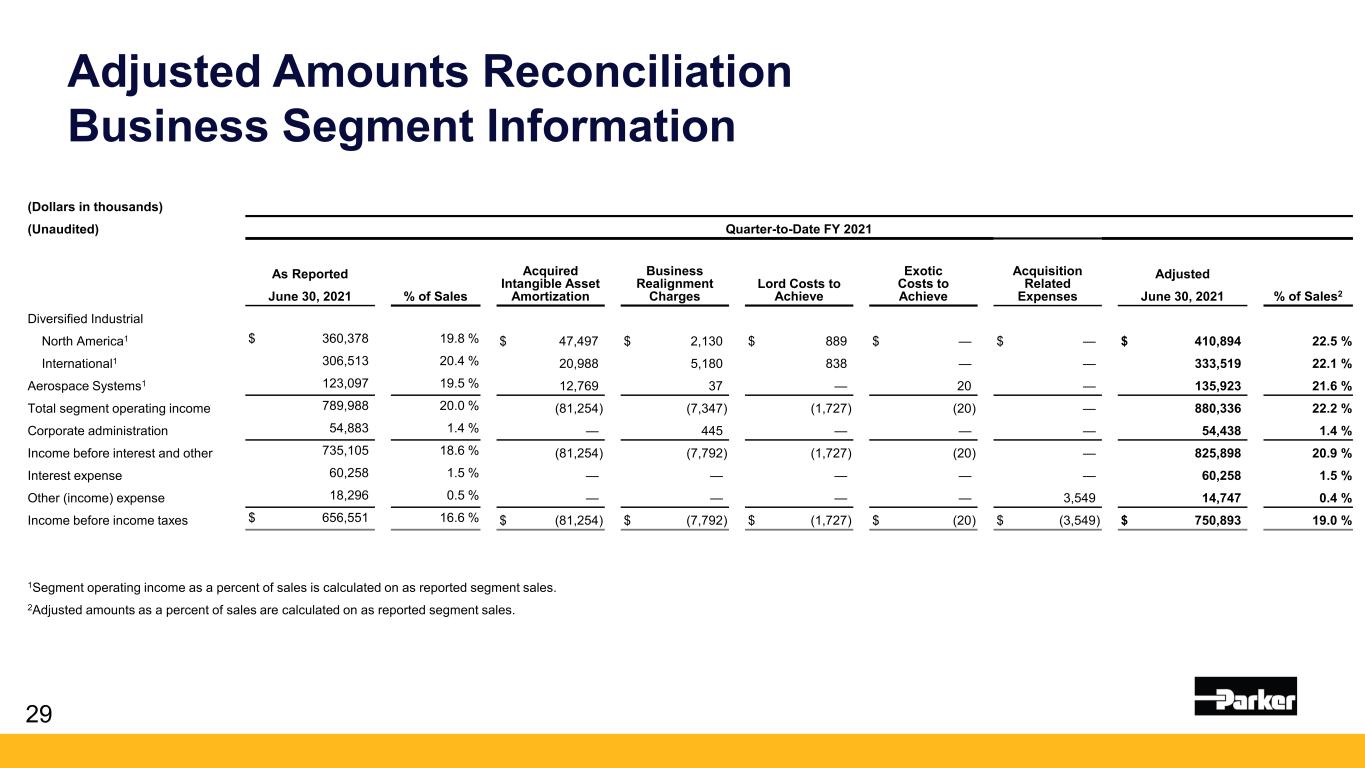
Adjusted Amounts Reconciliation Business Segment Information 29 (Dollars in thousands) (Unaudited) Quarter-to-Date FY 2021 % of Sales Acquired Intangible Asset Amortization Business Realignment Charges Lord Costs to Achieve Exotic Costs to Achieve Acquisition Related Expenses % of Sales2 As Reported Adjusted June 30, 2021 June 30, 2021 Diversified Industrial North America1 $ 360,378 19.8 % $ 47,497 $ 2,130 $ 889 $ — $ — $ 410,894 22.5 % International1 306,513 20.4 % 20,988 5,180 838 — — 333,519 22.1 % Aerospace Systems1 123,097 19.5 % 12,769 37 — 20 — 135,923 21.6 % Total segment operating income 789,988 20.0 % (81,254) (7,347) (1,727) (20) — 880,336 22.2 % Corporate administration 54,883 1.4 % — 445 — — — 54,438 1.4 % Income before interest and other 735,105 18.6 % (81,254) (7,792) (1,727) (20) — 825,898 20.9 % Interest expense 60,258 1.5 % — — — — — 60,258 1.5 % Other (income) expense 18,296 0.5 % — — — — 3,549 14,747 0.4 % Income before income taxes $ 656,551 16.6 % $ (81,254) $ (7,792) $ (1,727) $ (20) $ (3,549) $ 750,893 19.0 % 1Segment operating income as a percent of sales is calculated on as reported segment sales. 2Adjusted amounts as a percent of sales are calculated on as reported segment sales.
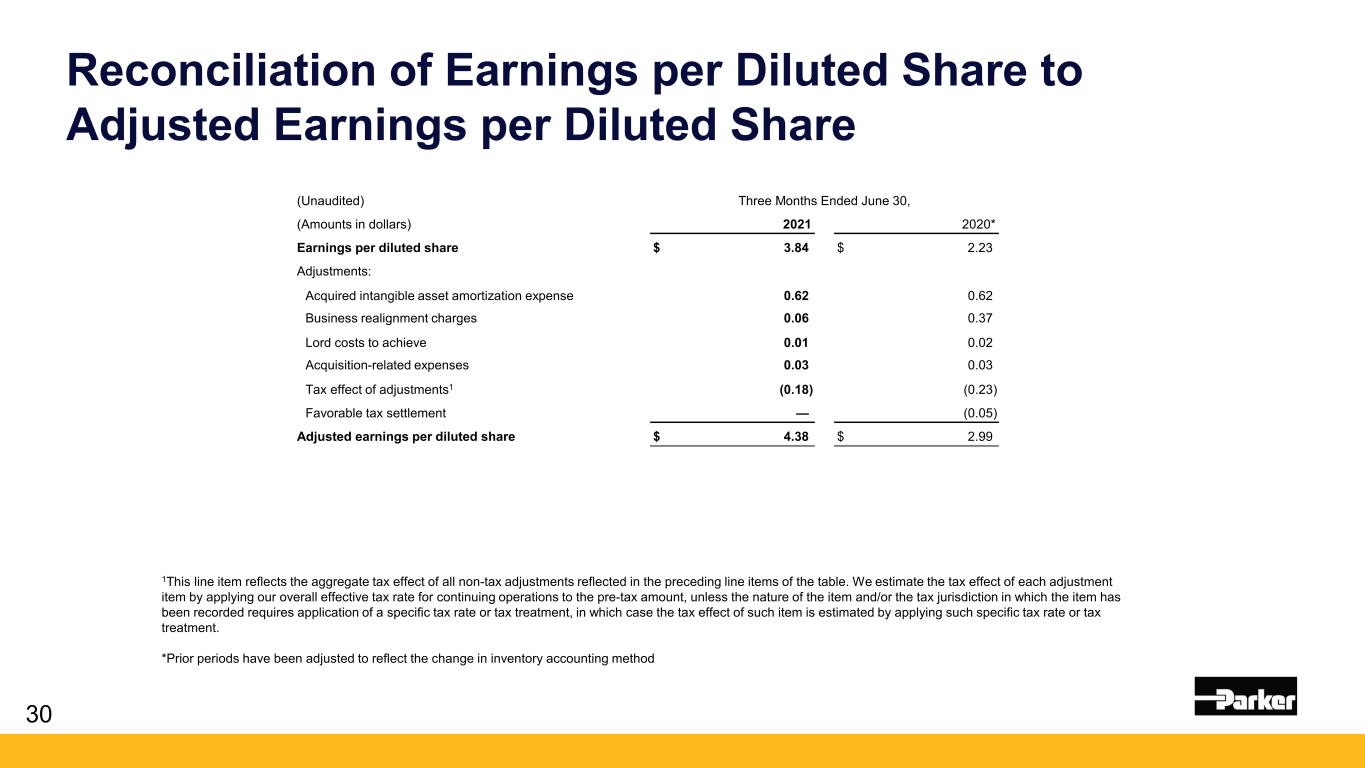
Reconciliation of Earnings per Diluted Share to Adjusted Earnings per Diluted Share 30 (Unaudited) Three Months Ended June 30, (Amounts in dollars) 2021 2020* Earnings per diluted share $ 3.84 $ 2.23 Adjustments: Acquired intangible asset amortization expense 0.62 0.62 Business realignment charges 0.06 0.37 Lord costs to achieve 0.01 0.02 Acquisition-related expenses 0.03 0.03 Tax effect of adjustments1 (0.18) (0.23) Favorable tax settlement — (0.05) Adjusted earnings per diluted share $ 4.38 $ 2.99 1This line item reflects the aggregate tax effect of all non-tax adjustments reflected in the preceding line items of the table. We estimate the tax effect of each adjustment item by applying our overall effective tax rate for continuing operations to the pre-tax amount, unless the nature of the item and/or the tax jurisdiction in which the item has been recorded requires application of a specific tax rate or tax treatment, in which case the tax effect of such item is estimated by applying such specific tax rate or tax treatment. *Prior periods have been adjusted to reflect the change in inventory accounting method
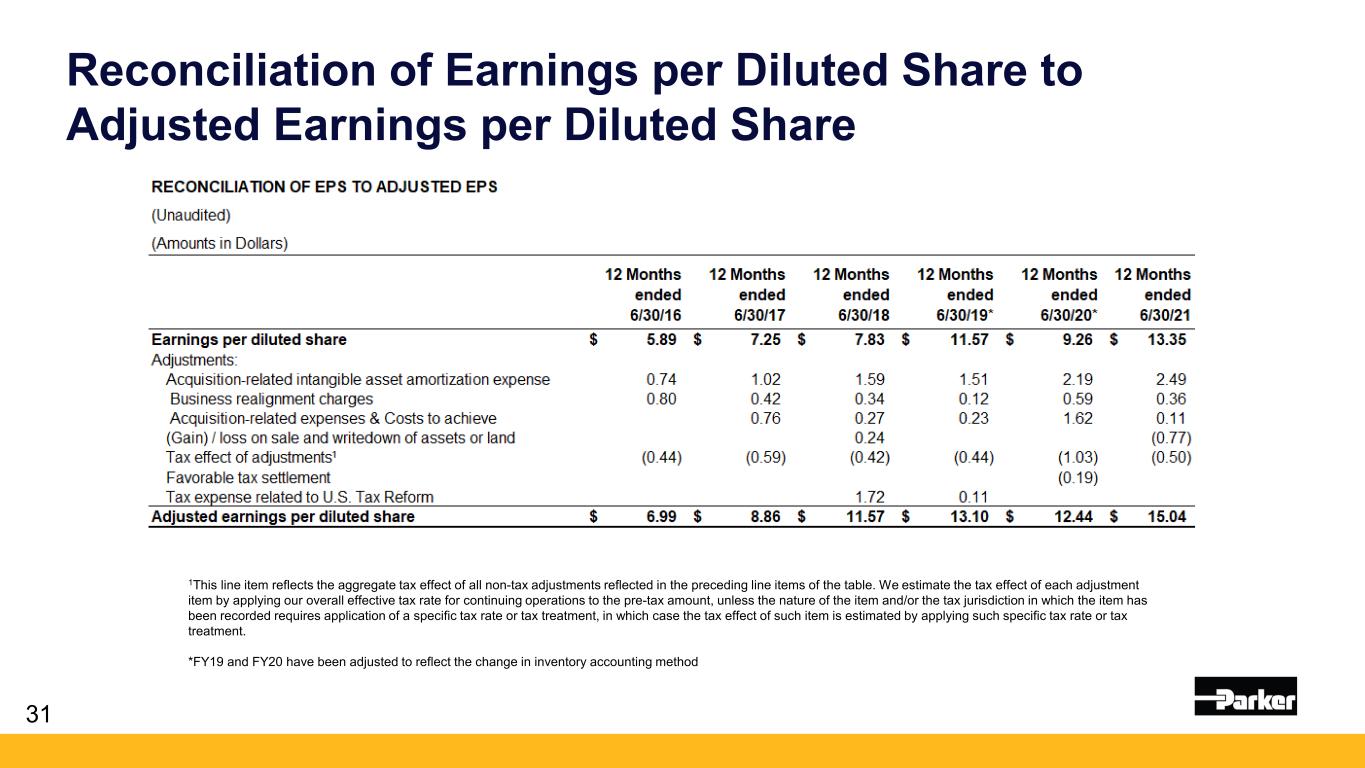
Reconciliation of Earnings per Diluted Share to Adjusted Earnings per Diluted Share 31 1This line item reflects the aggregate tax effect of all non-tax adjustments reflected in the preceding line items of the table. We estimate the tax effect of each adjustment item by applying our overall effective tax rate for continuing operations to the pre-tax amount, unless the nature of the item and/or the tax jurisdiction in which the item has been recorded requires application of a specific tax rate or tax treatment, in which case the tax effect of such item is estimated by applying such specific tax rate or tax treatment. *FY19 and FY20 have been adjusted to reflect the change in inventory accounting method
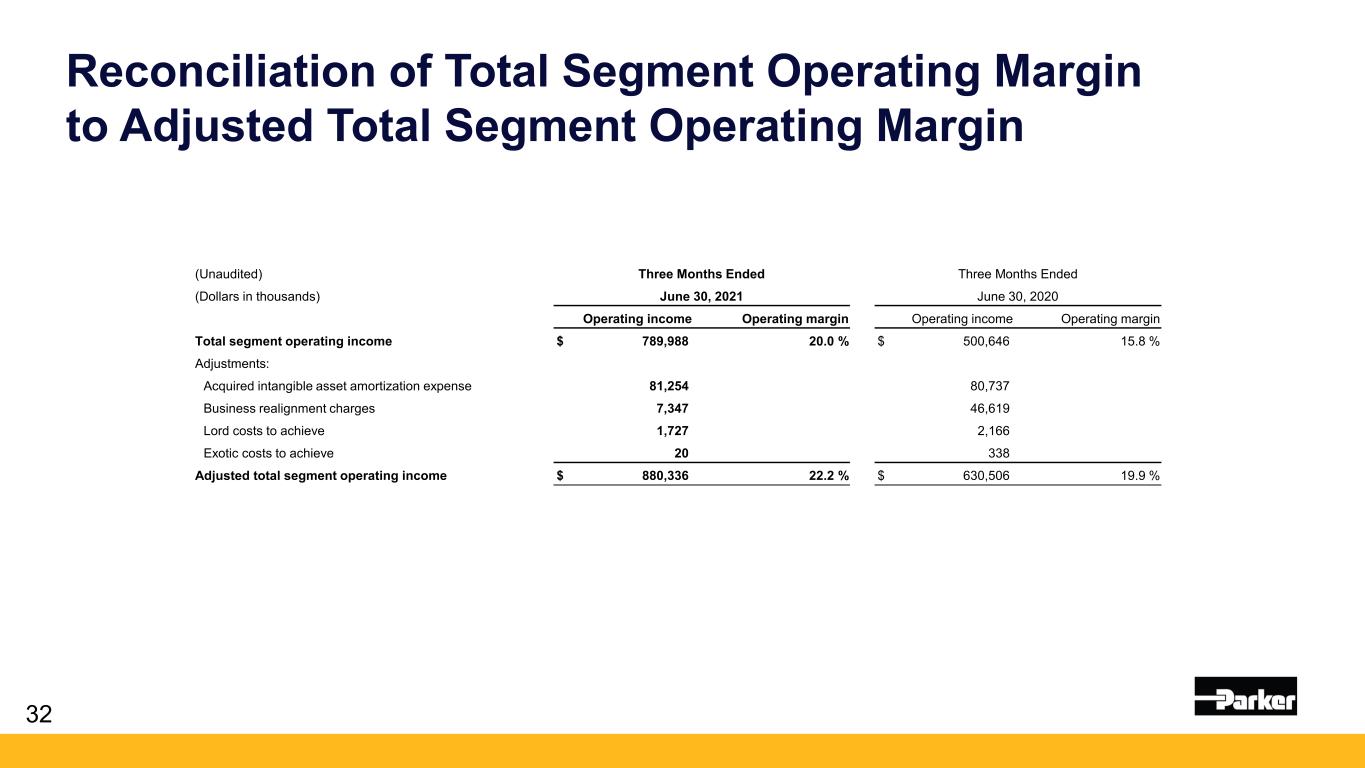
32 Reconciliation of Total Segment Operating Margin to Adjusted Total Segment Operating Margin (Unaudited) Three Months Ended Three Months Ended (Dollars in thousands) June 30, 2021 June 30, 2020 Operating income Operating margin Operating income Operating margin Total segment operating income $ 789,988 20.0 % $ 500,646 15.8 % Adjustments: Acquired intangible asset amortization expense 81,254 80,737 Business realignment charges 7,347 46,619 Lord costs to achieve 1,727 2,166 Exotic costs to achieve 20 338 Adjusted total segment operating income $ 880,336 22.2 % $ 630,506 19.9 %
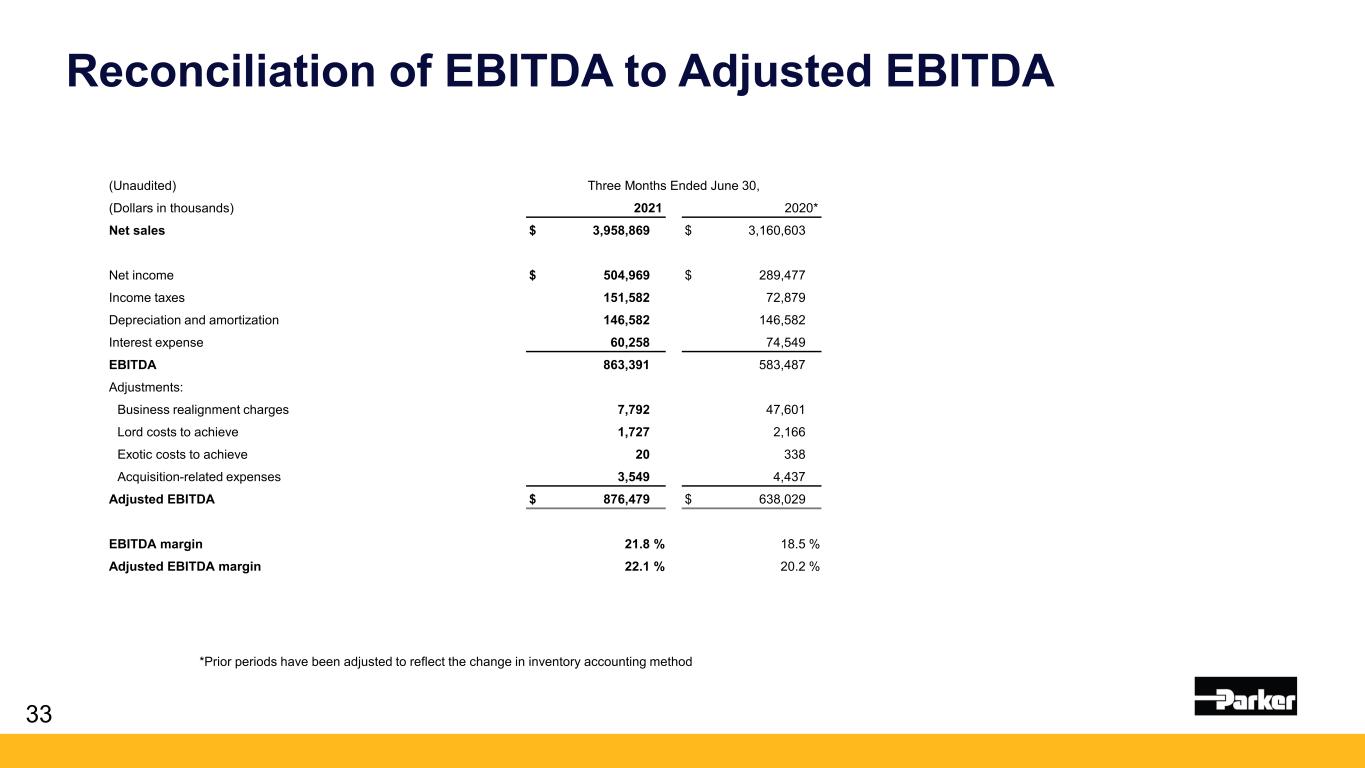
33 Reconciliation of EBITDA to Adjusted EBITDA (Unaudited) Three Months Ended June 30, (Dollars in thousands) 2021 2020* Net sales $ 3,958,869 $ 3,160,603 Net income $ 504,969 $ 289,477 Income taxes 151,582 72,879 Depreciation and amortization 146,582 146,582 Interest expense 60,258 74,549 EBITDA 863,391 583,487 Adjustments: Business realignment charges 7,792 47,601 Lord costs to achieve 1,727 2,166 Exotic costs to achieve 20 338 Acquisition-related expenses 3,549 4,437 Adjusted EBITDA $ 876,479 $ 638,029 EBITDA margin 21.8 % 18.5 % Adjusted EBITDA margin 22.1 % 20.2 % *Prior periods have been adjusted to reflect the change in inventory accounting method
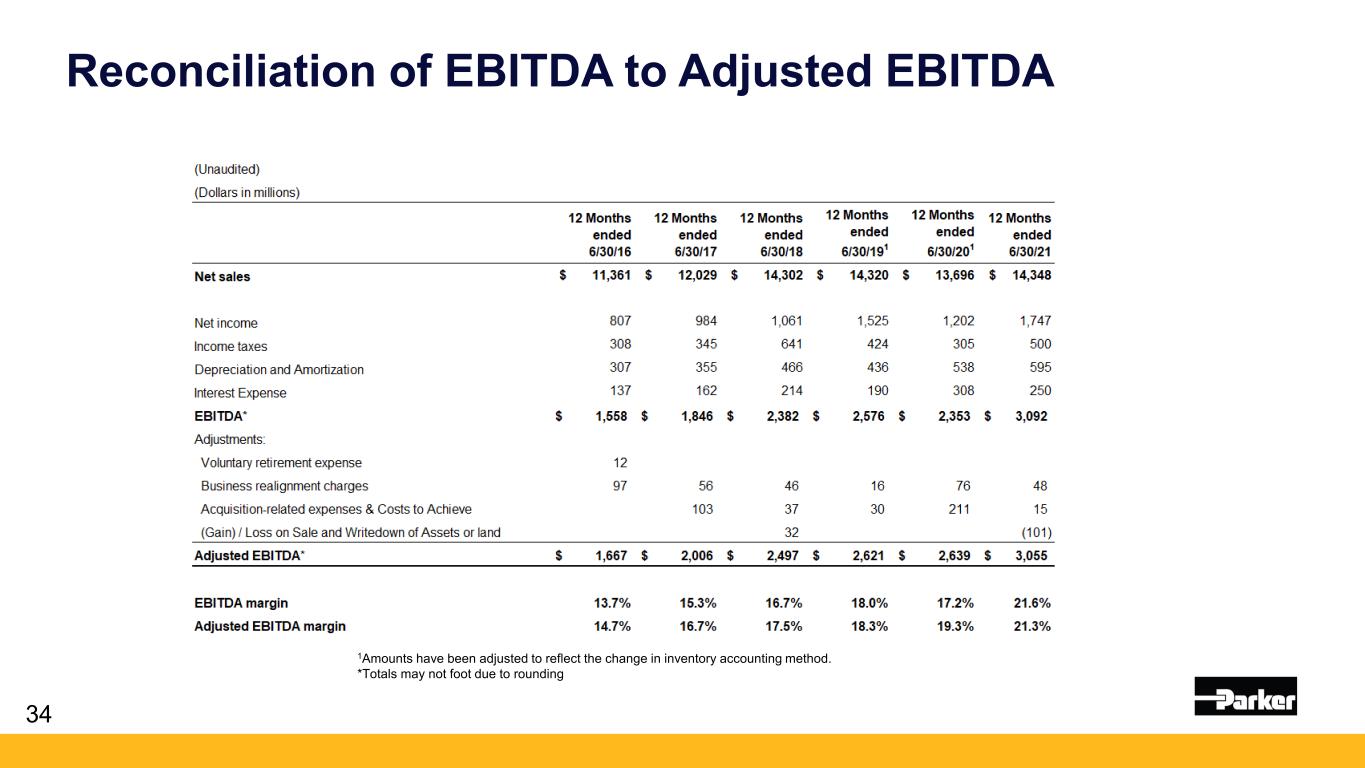
34 1Amounts have been adjusted to reflect the change in inventory accounting method. *Totals may not foot due to rounding Reconciliation of EBITDA to Adjusted EBITDA
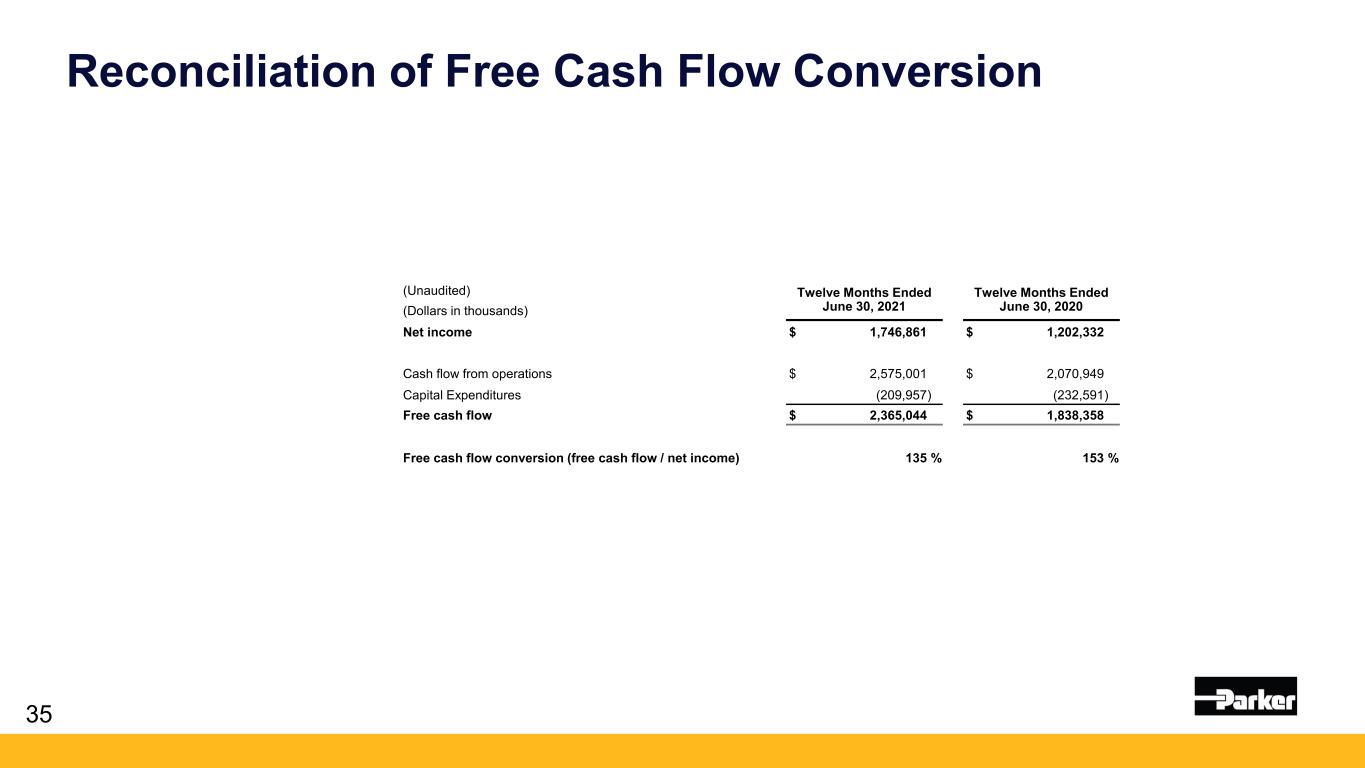
Reconciliation of Free Cash Flow Conversion 35 (Unaudited) Twelve Months Ended June 30, 2021 Twelve Months Ended June 30, 2020(Dollars in thousands) Net income $ 1,746,861 $ 1,202,332 Cash flow from operations $ 2,575,001 $ 2,070,949 Capital Expenditures (209,957) (232,591) Free cash flow $ 2,365,044 $ 1,838,358 Free cash flow conversion (free cash flow / net income) 135 % 153 %
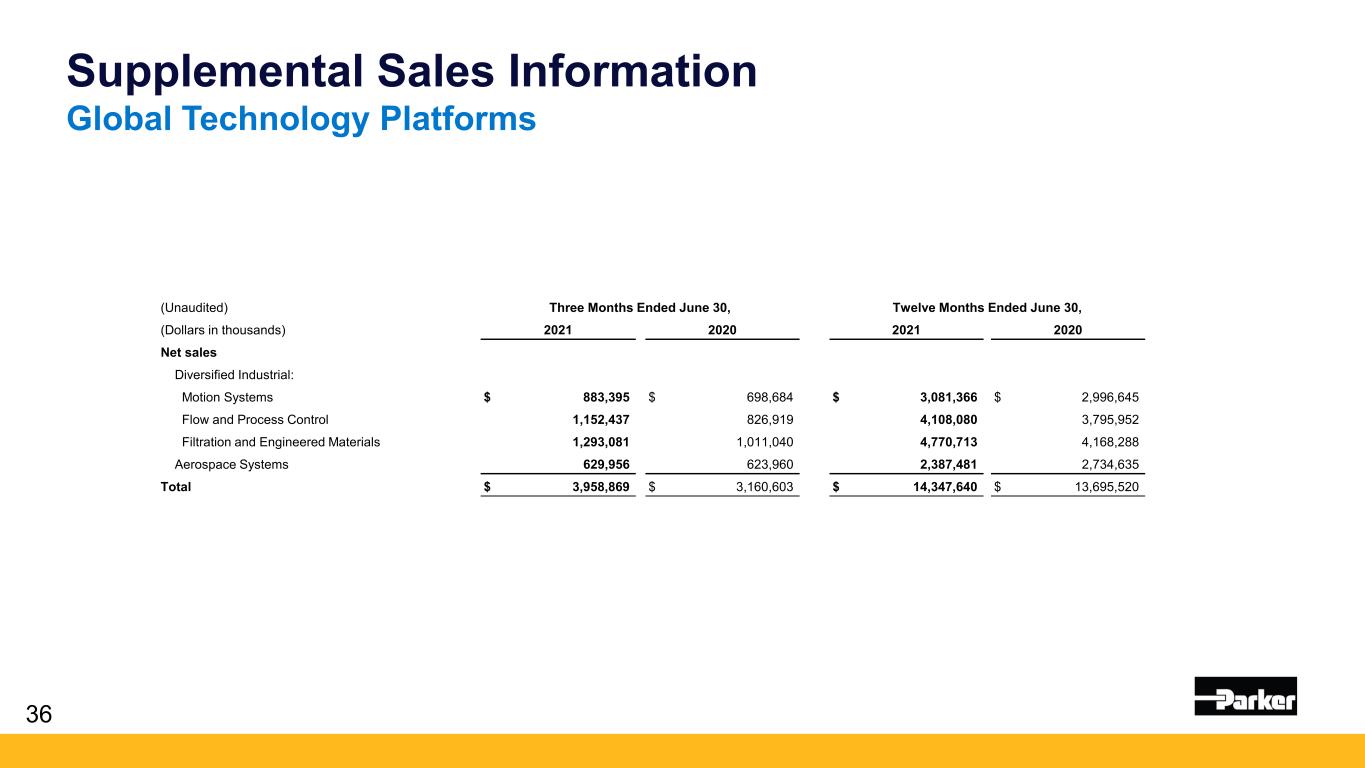
Supplemental Sales Information Global Technology Platforms 36 (Unaudited) Three Months Ended June 30, Twelve Months Ended June 30, (Dollars in thousands) 2021 2020 2021 2020 Net sales Diversified Industrial: Motion Systems $ 883,395 $ 698,684 $ 3,081,366 $ 2,996,645 Flow and Process Control 1,152,437 826,919 4,108,080 3,795,952 Filtration and Engineered Materials 1,293,081 1,011,040 4,770,713 4,168,288 Aerospace Systems 629,956 623,960 2,387,481 2,734,635 Total $ 3,958,869 $ 3,160,603 $ 14,347,640 $ 13,695,520
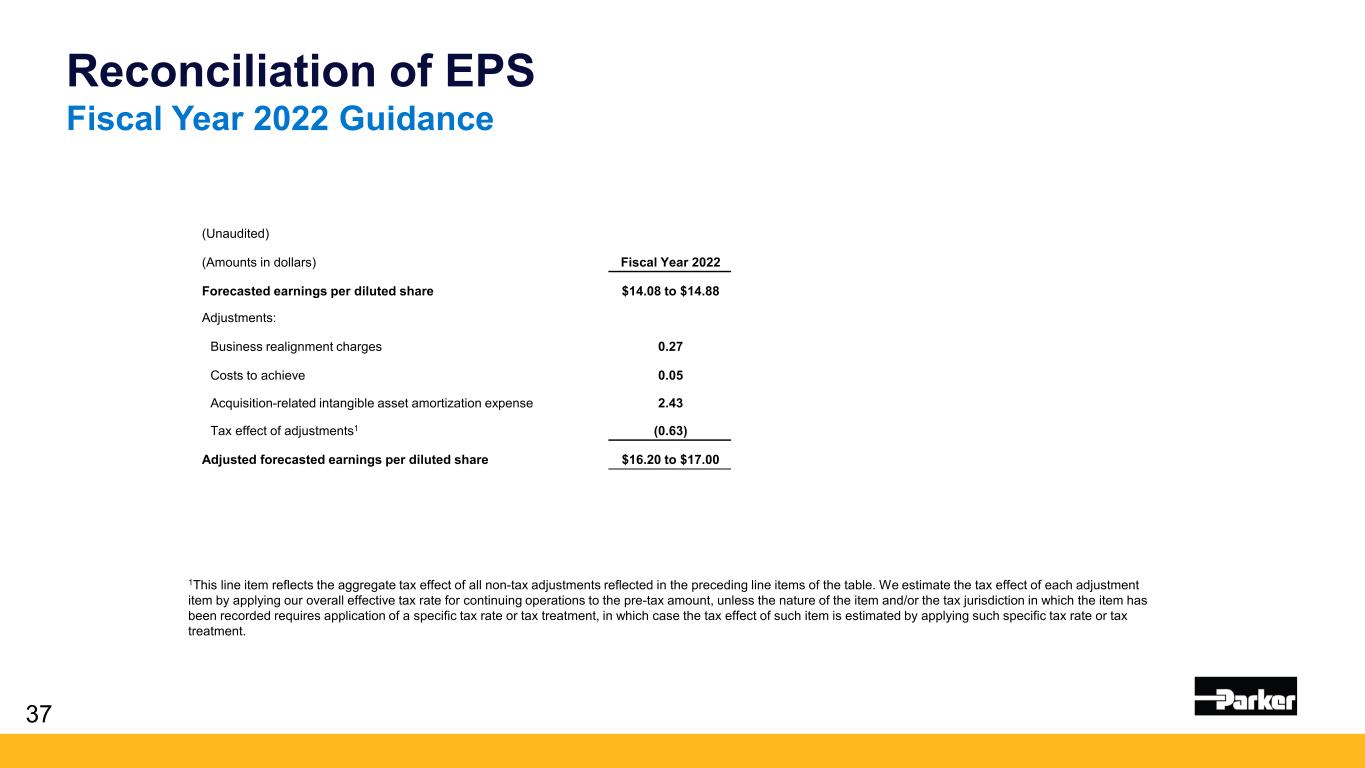
Reconciliation of EPS Fiscal Year 2022 Guidance 37 (Unaudited) (Amounts in dollars) Fiscal Year 2022 Forecasted earnings per diluted share $14.08 to $14.88 Adjustments: Business realignment charges 0.27 Costs to achieve 0.05 Acquisition-related intangible asset amortization expense 2.43 Tax effect of adjustments1 (0.63) Adjusted forecasted earnings per diluted share $16.20 to $17.00 1This line item reflects the aggregate tax effect of all non-tax adjustments reflected in the preceding line items of the table. We estimate the tax effect of each adjustment item by applying our overall effective tax rate for continuing operations to the pre-tax amount, unless the nature of the item and/or the tax jurisdiction in which the item has been recorded requires application of a specific tax rate or tax treatment, in which case the tax effect of such item is estimated by applying such specific tax rate or tax treatment.