Parker Hannifin Corporation Fiscal 2025 First Quarter Earnings Presentation October 31, 2024 Exhibit 99.2
Forward-Looking Statements and Non-GAAP Financial Measures Forward-looking statements contained in this and other written and oral reports are made based on known events and circumstances at the time of release, and as such, are subject in the future to unforeseen uncertainties and risks. Often but not always, these statements may be identified from the use of forward-looking terminology such as “anticipates,” “believes,” “may,” “should,” “could,” “expects,” “targets,” “is likely,” “will,” or the negative of these terms and similar expressions, and may also include statements regarding future performance, orders, earnings projections, events or developments. Parker cautions readers not to place undue reliance on these statements. It is possible that the future performance may differ materially from expectations, including those based on past performance. Among other factors that may affect future performance are: changes in business relationships with and orders by or from major customers, suppliers or distributors, including delays or cancellations in shipments; disputes regarding contract terms, changes in contract costs and revenue estimates for new development programs; changes in product mix; ability to identify acceptable strategic acquisition targets; uncertainties surrounding timing, successful completion or integration of acquisitions and similar transactions; ability to successfully divest businesses planned for divestiture and realize the anticipated benefits of such divestitures; the determination and ability to successfully undertake business realignment activities and the expected costs, including cost savings, thereof; ability to implement successfully business and operating initiatives, including the timing, price and execution of share repurchases and other capital initiatives; availability, cost increases of or other limitations on our access to raw materials, component products and/or commodities if associated costs cannot be recovered in product pricing; ability to manage costs related to insurance and employee retirement and health care benefits; legal and regulatory developments and other government actions, including related to environmental protection, and associated compliance costs; supply chain and labor disruptions, including as a result of labor shortages; threats associated with international conflicts and cybersecurity risks and risks associated with protecting our intellectual property; uncertainties surrounding the ultimate resolution of outstanding legal proceedings, including the outcome of any appeals; effects on market conditions, including sales and pricing, resulting from global reactions to U.S. trade policies; manufacturing activity, air travel trends, currency exchange rates, difficulties entering new markets and economic conditions such as inflation, deflation, interest rates and credit availability; inability to obtain, or meet conditions imposed for, required governmental and regulatory approvals; changes in the tax laws in the United States and foreign jurisdictions and judicial or regulatory interpretations thereof; and large scale disasters, such as floods, earthquakes, hurricanes, industrial accidents and pandemics. Readers should also consider forward-looking statements in light of risk factors discussed in Parker’s Annual Report on Form 10-K for the fiscal year ended June 30, 2024 and other periodic filings made with the SEC. This presentation contains references to non-GAAP financial information including adjusted net income, organic sales, adjusted earnings per share, adjusted segment operating margin for Parker and by segment, EBITDA, EBITDA margin, adjusted EBITDA, adjusted EBITDA margin, Net Debt to Adjusted EBITDA, free cash flow, and free cash flow margin. As used in this presentation, EBITDA is defined as earnings before interest, taxes, depreciation and amortization. Adjusted EBITDA is defined as EBITDA before business realignment, integration costs to achieve, acquisition related expenses, and other one-time items. Free cash flow is defined as cash flow from operations less capital expenditures. Although adjusted net income, organic sales, adjusted earnings per share, adjusted segment operating margin for Parker and by segment, EBITDA, EBITDA margin, adjusted EBITDA, adjusted EBITDA margin, Net Debt to Adjusted EBITDA, free cash flow, and free cash flow margin are not measures of performance calculated in accordance with GAAP, we believe that they are useful to an investor in evaluating the company performance for the periods presented. Detailed reconciliations of these non-GAAP financial measures to the comparable GAAP financial measures have been included in the appendix to this presentation. Please visit investors.parker.com for more information. 2
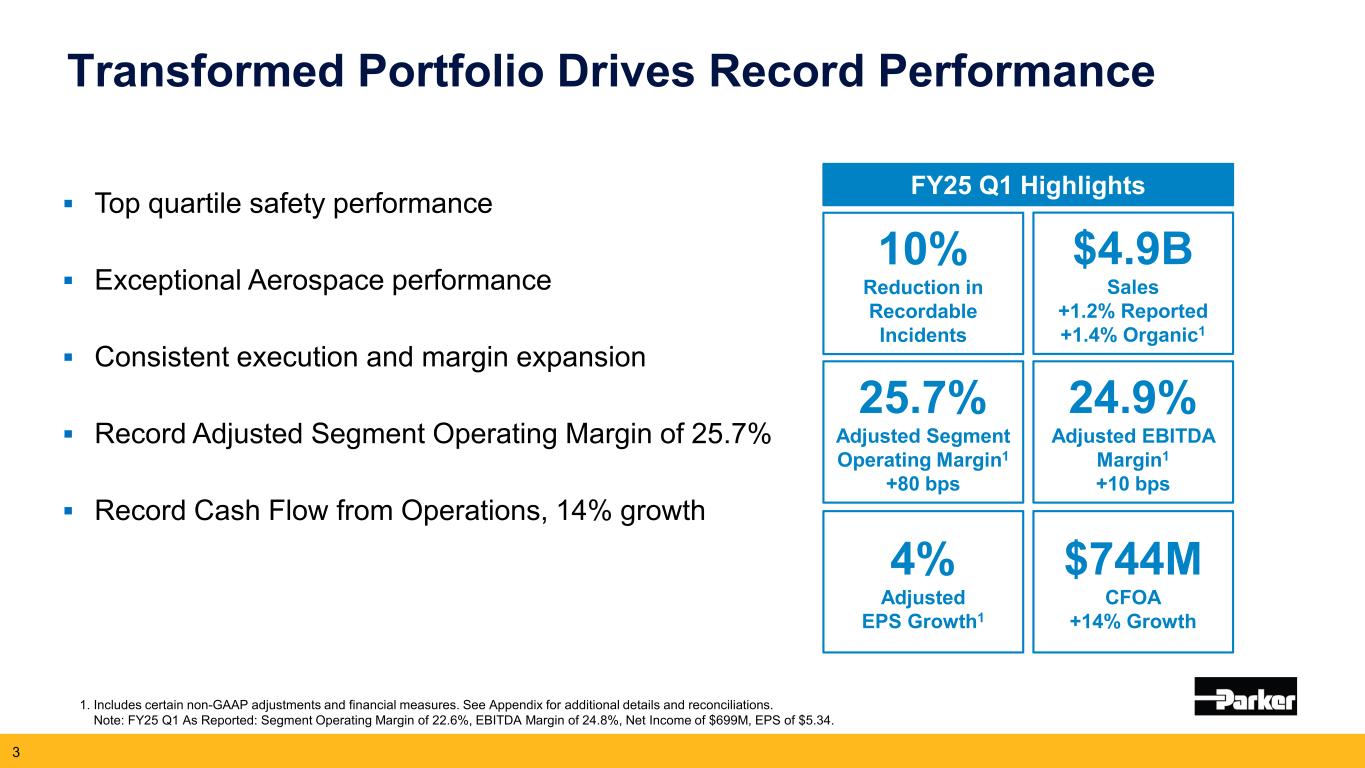
3 FY25 Q1 Highlights $4.9B Sales +1.2% Reported +1.4% Organic1 25.7% Adjusted Segment Operating Margin1 +80 bps 24.9% Adjusted EBITDA Margin1 +10 bps $744M CFOA +14% Growth Top quartile safety performance Exceptional Aerospace performance Consistent execution and margin expansion Record Adjusted Segment Operating Margin of 25.7% Record Cash Flow from Operations, 14% growth Transformed Portfolio Drives Record Performance 10% Reduction in Recordable Incidents 1. Includes certain non-GAAP adjustments and financial measures. See Appendix for additional details and reconciliations. Note: FY25 Q1 As Reported: Segment Operating Margin of 22.6%, EBITDA Margin of 24.8%, Net Income of $699M, EPS of $5.34. 4% Adjusted EPS Growth1

Why We Win Strong Competitive Advantages 4 Interconnected Technologies Enables comprehensive solutions for customers Application Engineering Technical expertise creates competitive advantage Innovative Products Deep customer partnership to uncover unmet needs Distribution Network Serving global aftermarket & small to mid-sized OEMs Decentralized structure, strategic positioning & operational excellence Parker’s Business System
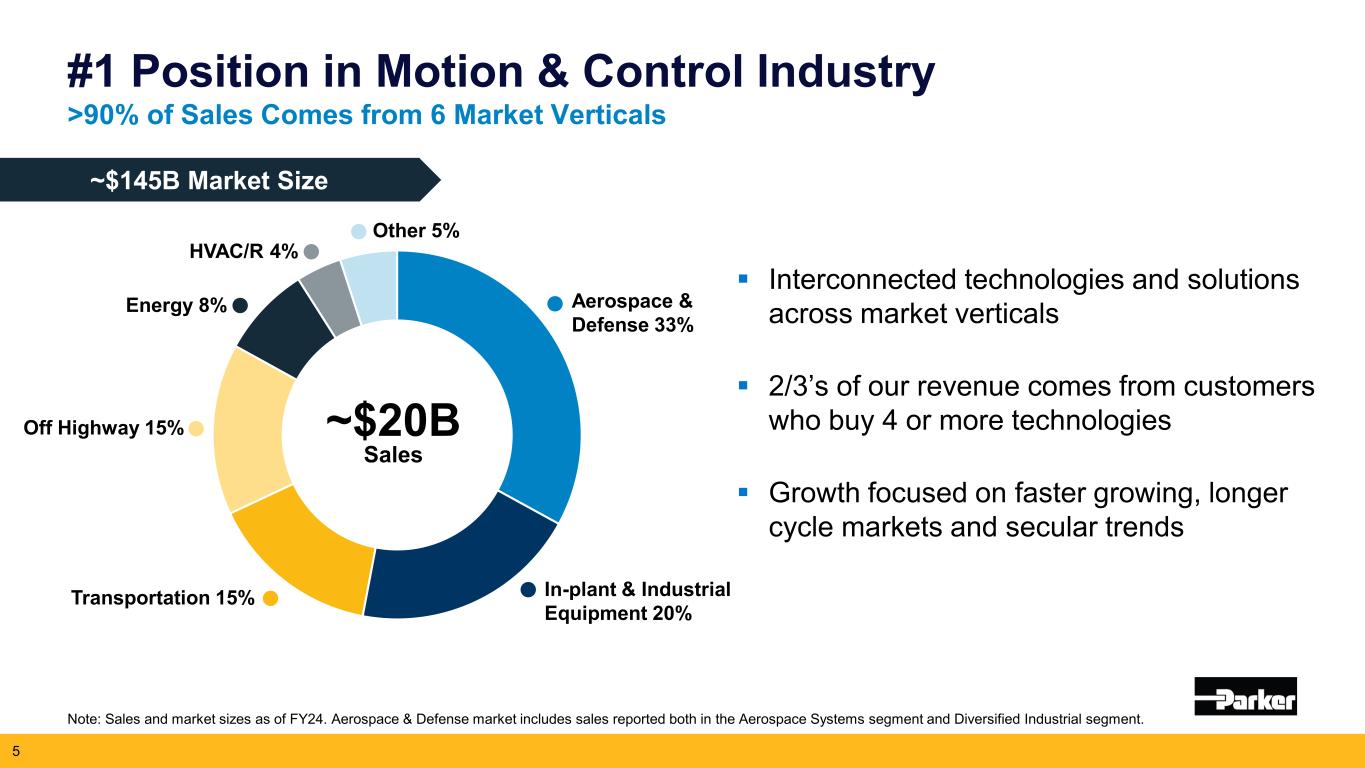
~$20B Sales #1 Position in Motion & Control Industry >90% of Sales Comes from 6 Market Verticals 5 Interconnected technologies and solutions across market verticals 2/3’s of our revenue comes from customers who buy 4 or more technologies Growth focused on faster growing, longer cycle markets and secular trends In-plant & Industrial Equipment 20% Other 5% HVAC/R 4% Energy 8% Aerospace & Defense 33% Off Highway 15% Transportation 15% ~$145B Market Size Note: Sales and market sizes as of FY24. Aerospace & Defense market includes sales reported both in the Aerospace Systems segment and Diversified Industrial segment.
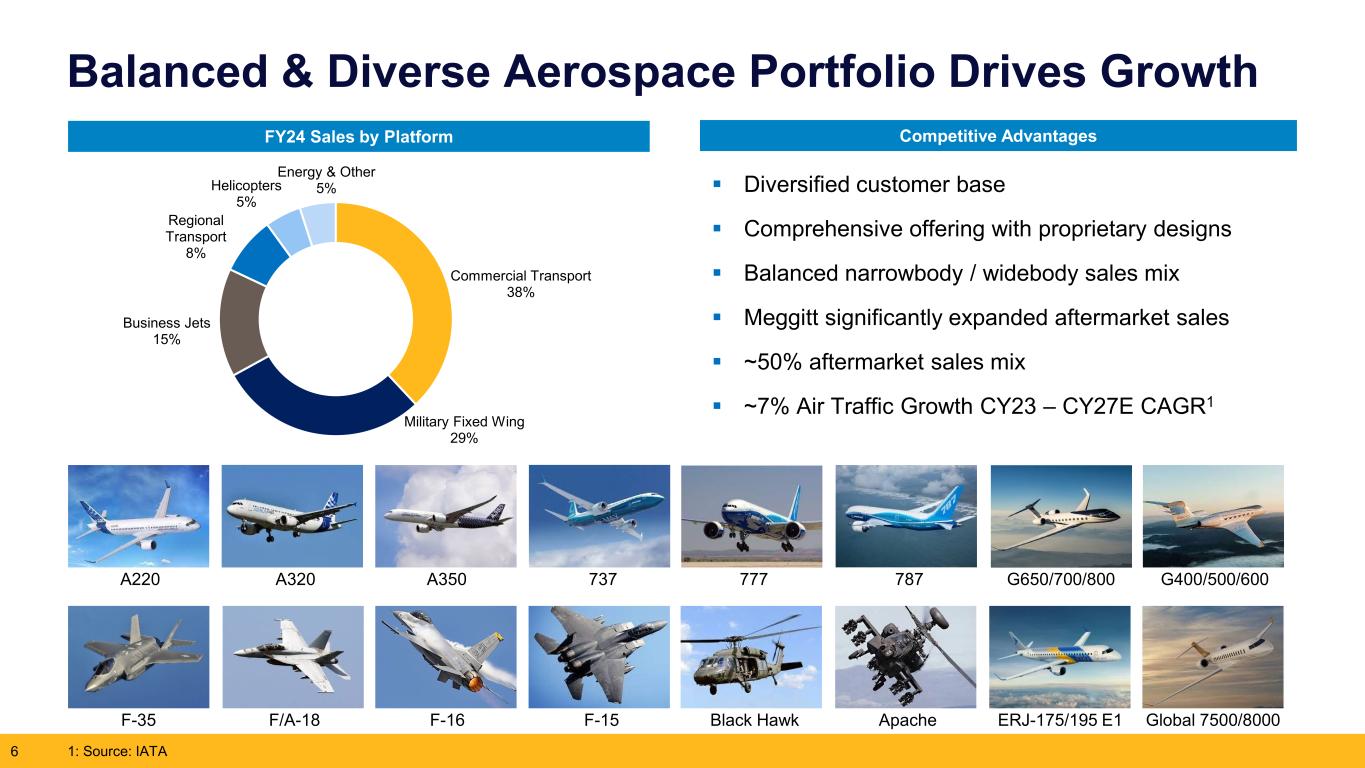
Balanced & Diverse Aerospace Portfolio Drives Growth Commercial Transport 38% Military Fixed Wing 29% Business Jets 15% Regional Transport 8% Helicopters 5% Energy & Other 5% FY24 Sales by Platform 6 Competitive Advantages Diversified customer base Comprehensive offering with proprietary designs Balanced narrowbody / widebody sales mix Meggitt significantly expanded aftermarket sales ~50% aftermarket sales mix ~7% Air Traffic Growth CY23 – CY27E CAGR1 F-35 F/A-18 F-16 F-15 ERJ-175/195 E1 Global 7500/8000Black Hawk Apache A220 A320 777 G650/700/800 G400/500/600787A350 737 1: Source: IATA
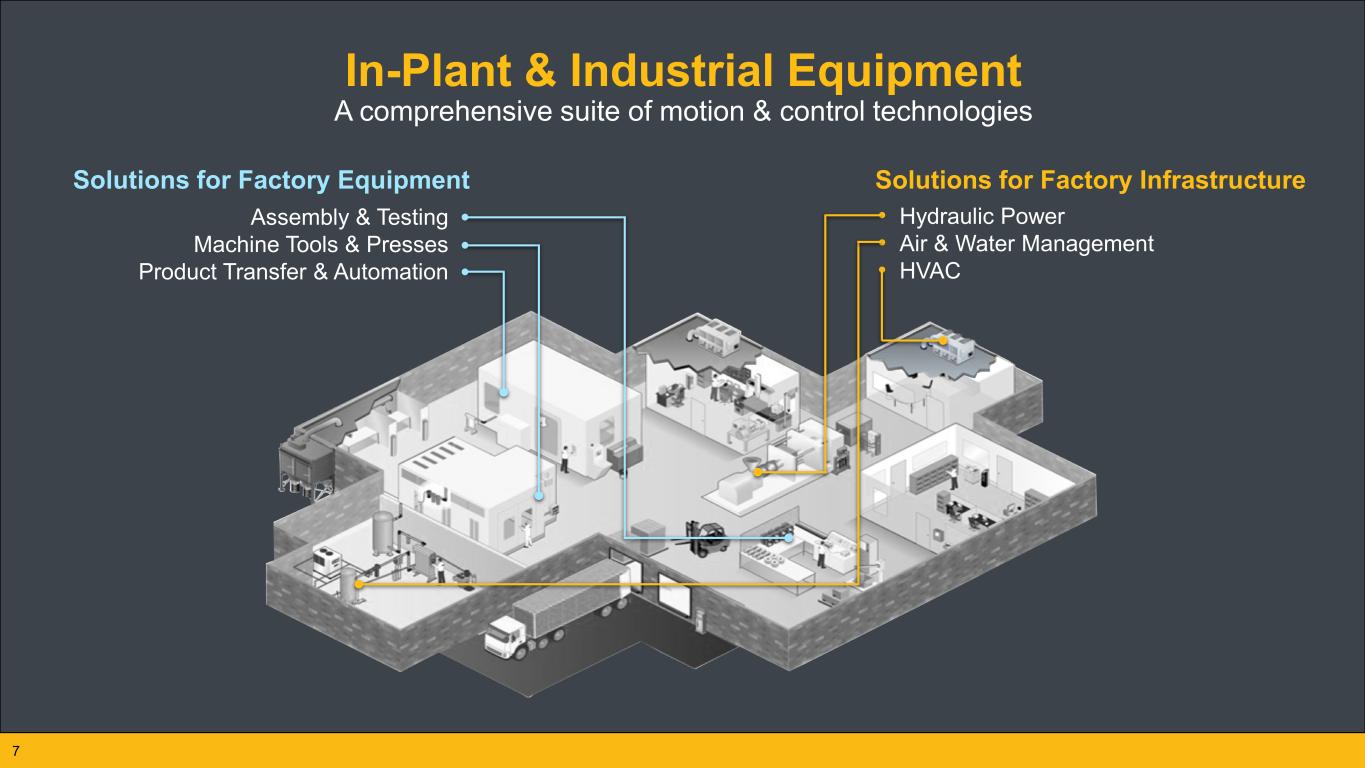
• Hydraulic Power • Air & Water Management • HVAC In-Plant & Industrial Equipment A comprehensive suite of motion & control technologies Solutions for Factory InfrastructureSolutions for Factory Equipment Assembly & Testing Machine Tools & Presses Product Transfer & Automation 7
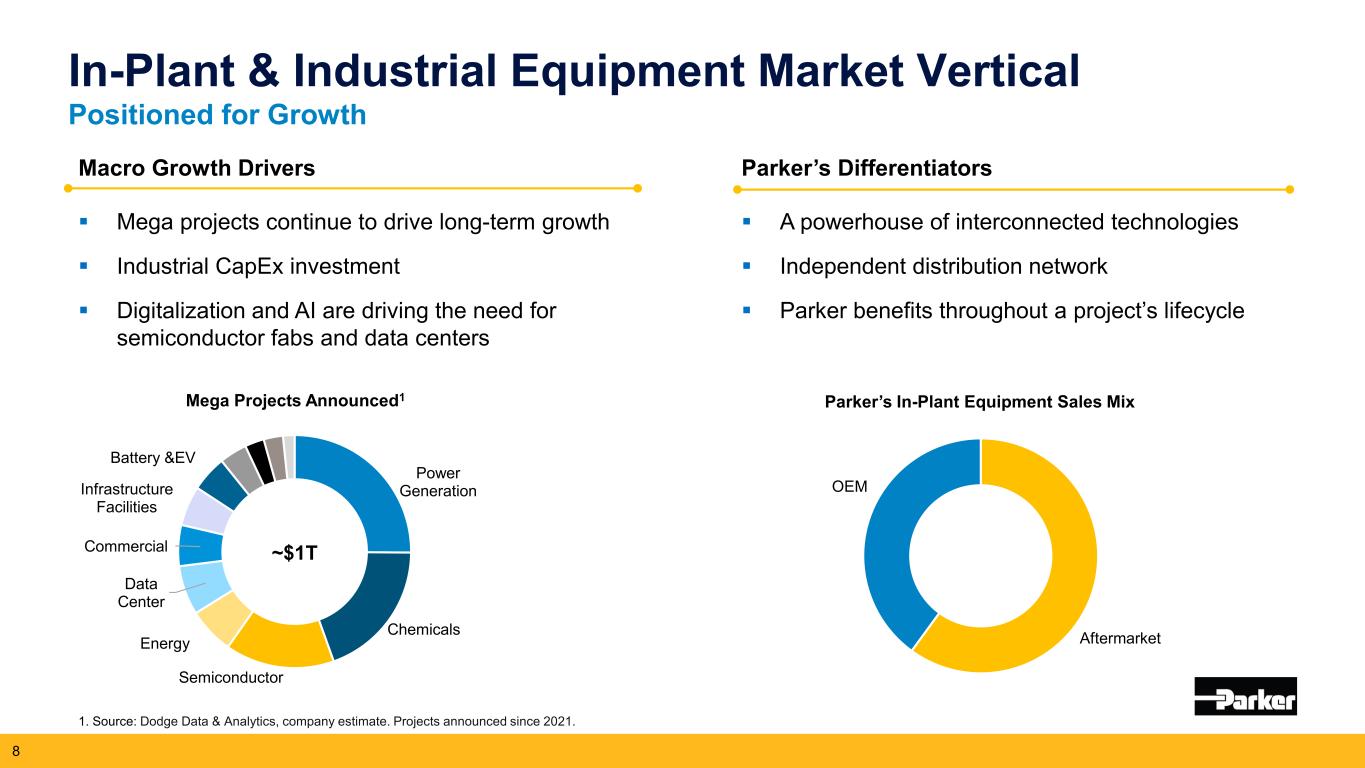
In-Plant & Industrial Equipment Market Vertical Positioned for Growth 8 Mega Projects Announced1 1. Source: Dodge Data & Analytics, company estimate. Projects announced since 2021. Macro Growth Drivers Mega projects continue to drive long-term growth Industrial CapEx investment Digitalization and AI are driving the need for semiconductor fabs and data centers Aftermarket OEM Parker’s Differentiators A powerhouse of interconnected technologies Independent distribution network Parker benefits throughout a project’s lifecycle Parker’s In-Plant Equipment Sales Mix Power Generation Chemicals Semiconductor Energy Data Center Commercial Infrastructure Facilities Battery &EV ~$1T

Summary of Fiscal 2025 1st Quarter Highlights
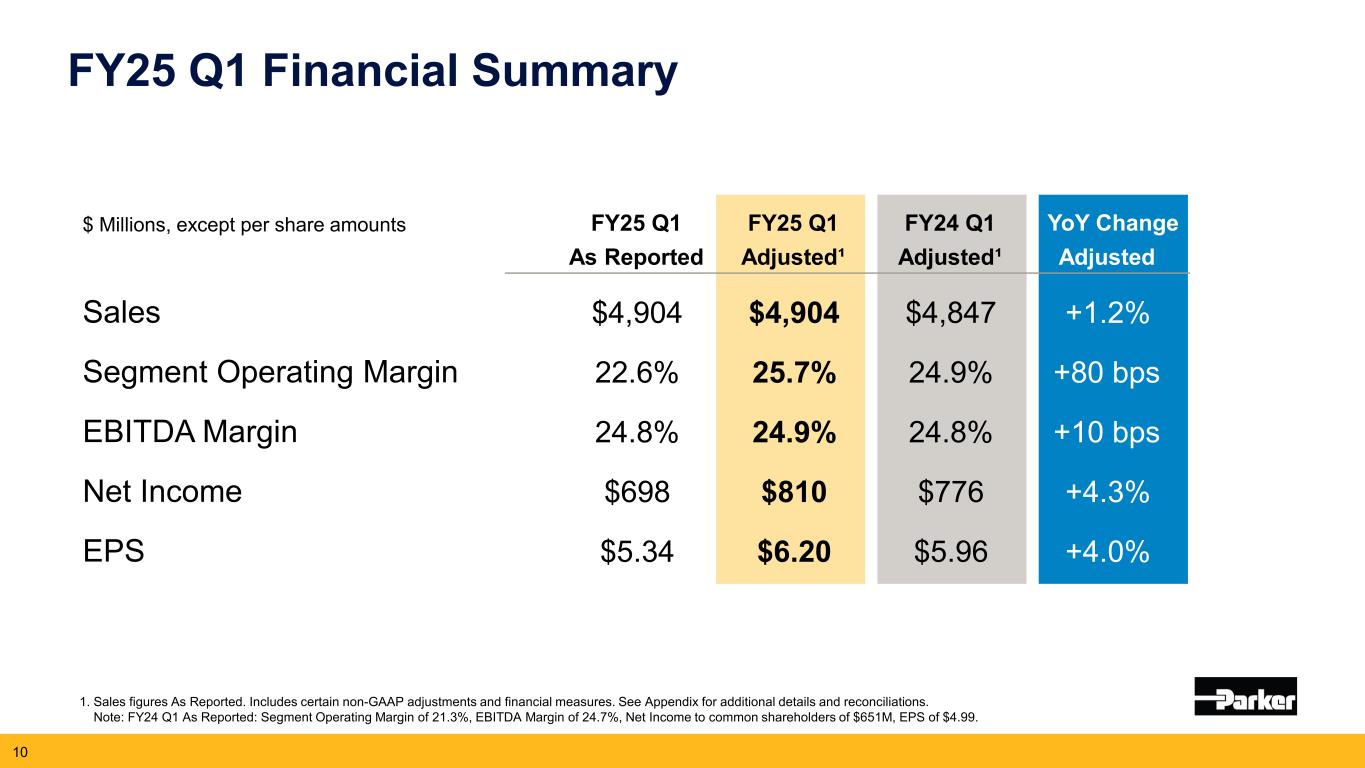
FY25 Q1 Financial Summary 1. Sales figures As Reported. Includes certain non-GAAP adjustments and financial measures. See Appendix for additional details and reconciliations. Note: FY24 Q1 As Reported: Segment Operating Margin of 21.3%, EBITDA Margin of 24.7%, Net Income to common shareholders of $651M, EPS of $4.99. 10 $ Millions, except per share amounts FY25 Q1 FY25 Q1 FY24 Q1 YoY Change As Reported Adjusted¹ Adjusted¹ Adjusted Sales $4,904 $4,904 $4,847 +1.2% Segment Operating Margin 22.6% 25.7% 24.9% +80 bps EBITDA Margin 24.8% 24.9% 24.8% +10 bps Net Income $698 $810 $776 +4.3% EPS $5.34 $6.20 $5.96 +4.0%
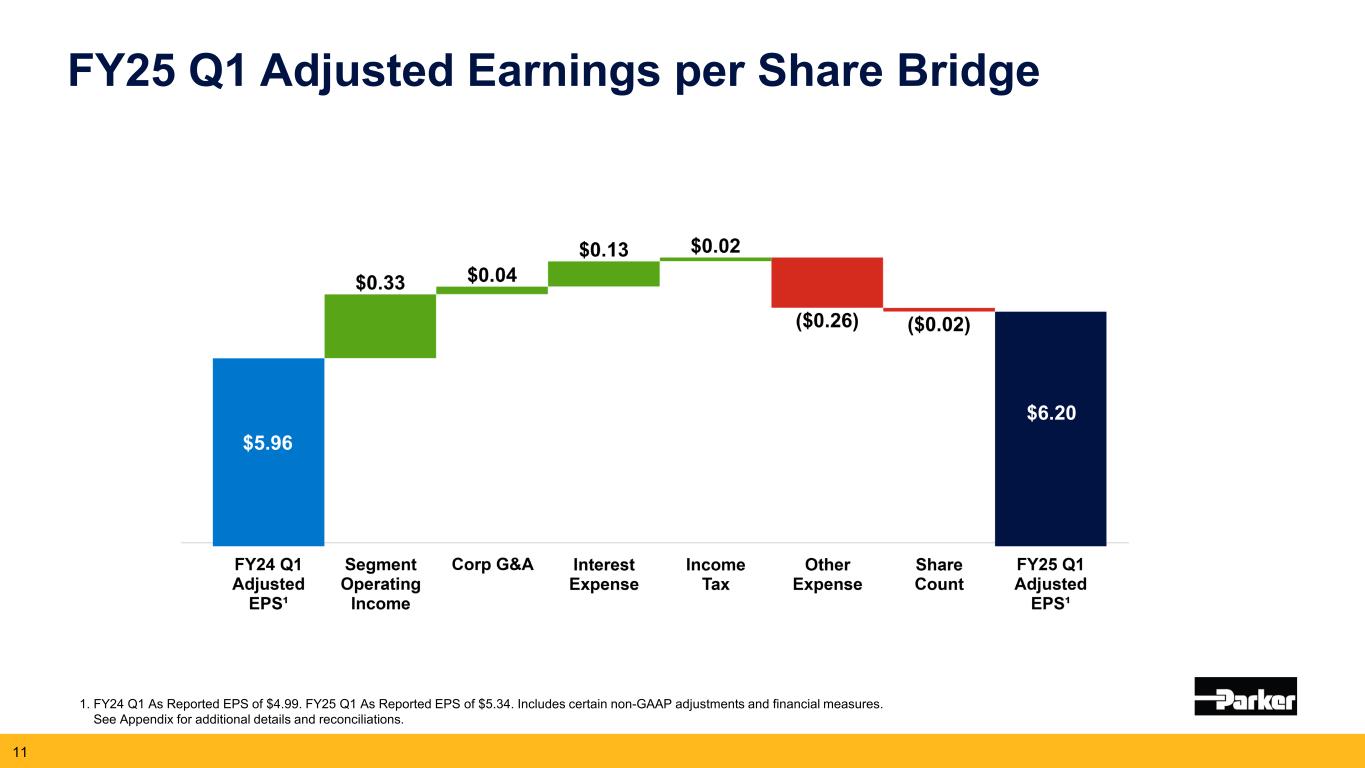
FY25 Q1 Adjusted Earnings per Share Bridge 1. FY24 Q1 As Reported EPS of $4.99. FY25 Q1 As Reported EPS of $5.34. Includes certain non-GAAP adjustments and financial measures. See Appendix for additional details and reconciliations. 11 $5.16 $6.13 $4.74 $5.96 $5.96 $6.20
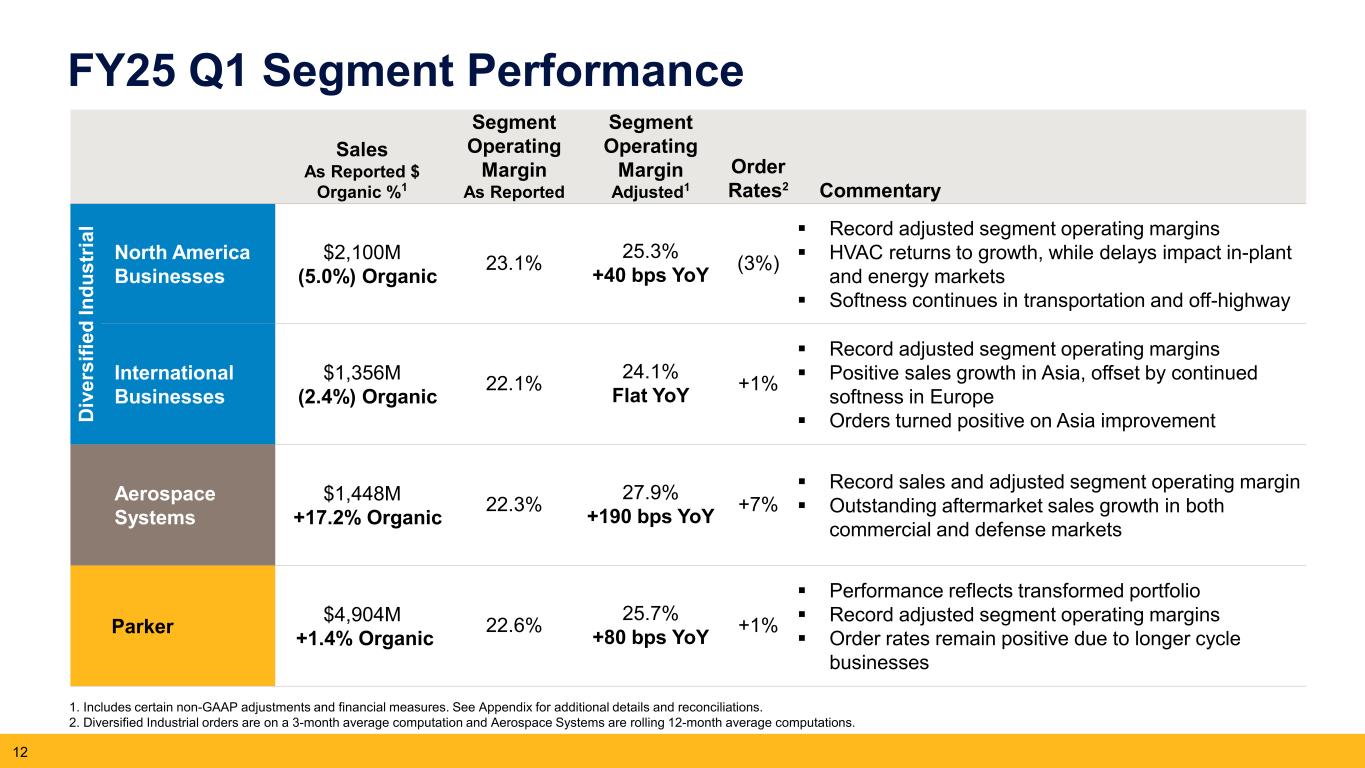
FY25 Q1 Segment Performance Sales As Reported $ Organic %1 Segment Operating Margin As Reported Segment Operating Margin Adjusted1 Order Rates2 Commentary D iv er si fie d In du st ria l North America Businesses $2,100M (5.0%) Organic 23.1% 25.3% +40 bps YoY (3%) Record adjusted segment operating margins HVAC returns to growth, while delays impact in-plant and energy markets Softness continues in transportation and off-highway International Businesses $1,356M (2.4%) Organic 22.1% 24.1% Flat YoY +1% Record adjusted segment operating margins Positive sales growth in Asia, offset by continued softness in Europe Orders turned positive on Asia improvement Aerospace Systems $1,448M +17.2% Organic 22.3% 27.9% +190 bps YoY +7% Record sales and adjusted segment operating margin Outstanding aftermarket sales growth in both commercial and defense markets Parker $4,904M +1.4% Organic 22.6% 25.7% +80 bps YoY +1% Performance reflects transformed portfolio Record adjusted segment operating margins Order rates remain positive due to longer cycle businesses 1. Includes certain non-GAAP adjustments and financial measures. See Appendix for additional details and reconciliations. 2. Diversified Industrial orders are on a 3-month average computation and Aerospace Systems are rolling 12-month average computations. 12
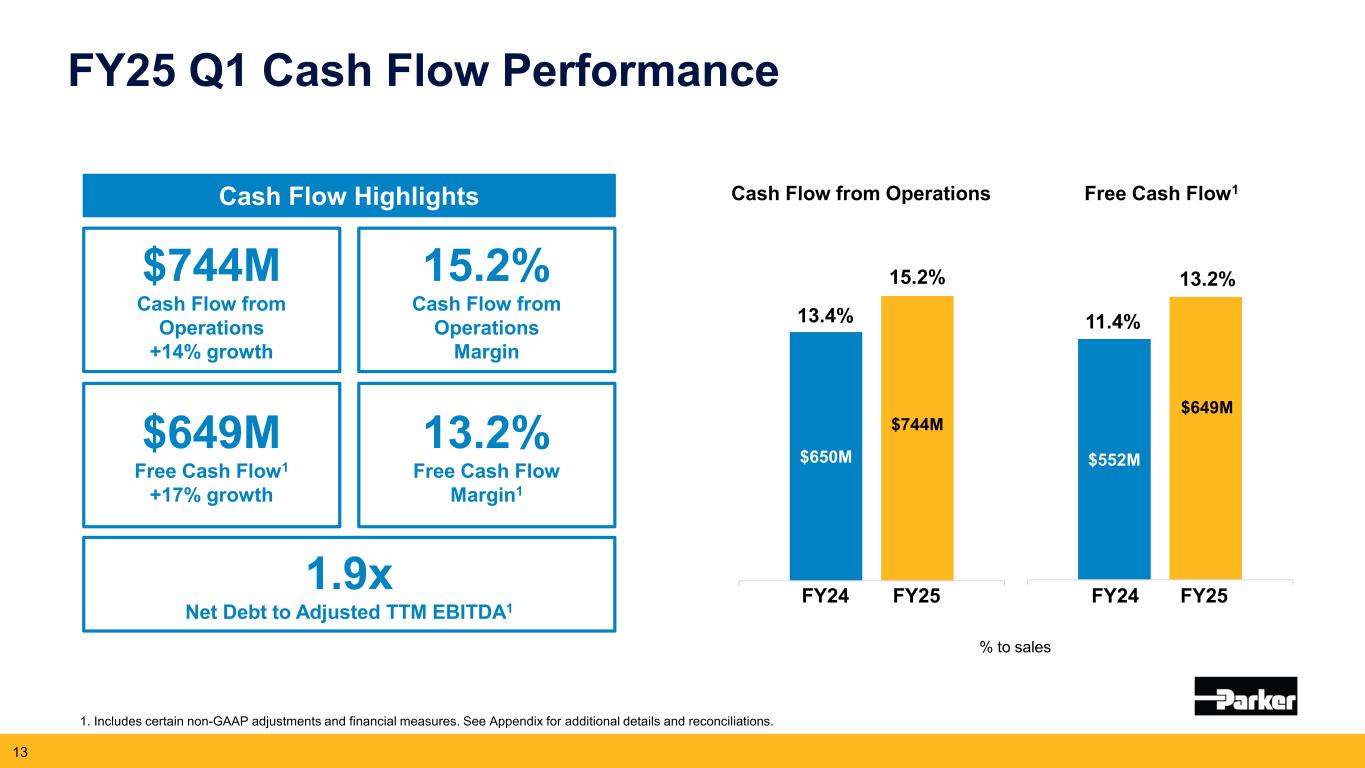
$552M $649M CFOA $650M $744M CFOA FY25 Q1 Cash Flow Performance 1. Includes certain non-GAAP adjustments and financial measures. See Appendix for additional details and reconciliations. 13 Free Cash Flow1 11.4% 13.2% Cash Flow from Operations 13.4% 15.2% FY24 FY25 % to sales $744M Cash Flow from Operations +14% growth 15.2% Cash Flow from Operations Margin 13.2% Free Cash Flow Margin1 $649M Free Cash Flow1 +17% growth 1.9x Net Debt to Adjusted TTM EBITDA1 Cash Flow Highlights FY25FY24

Outlook
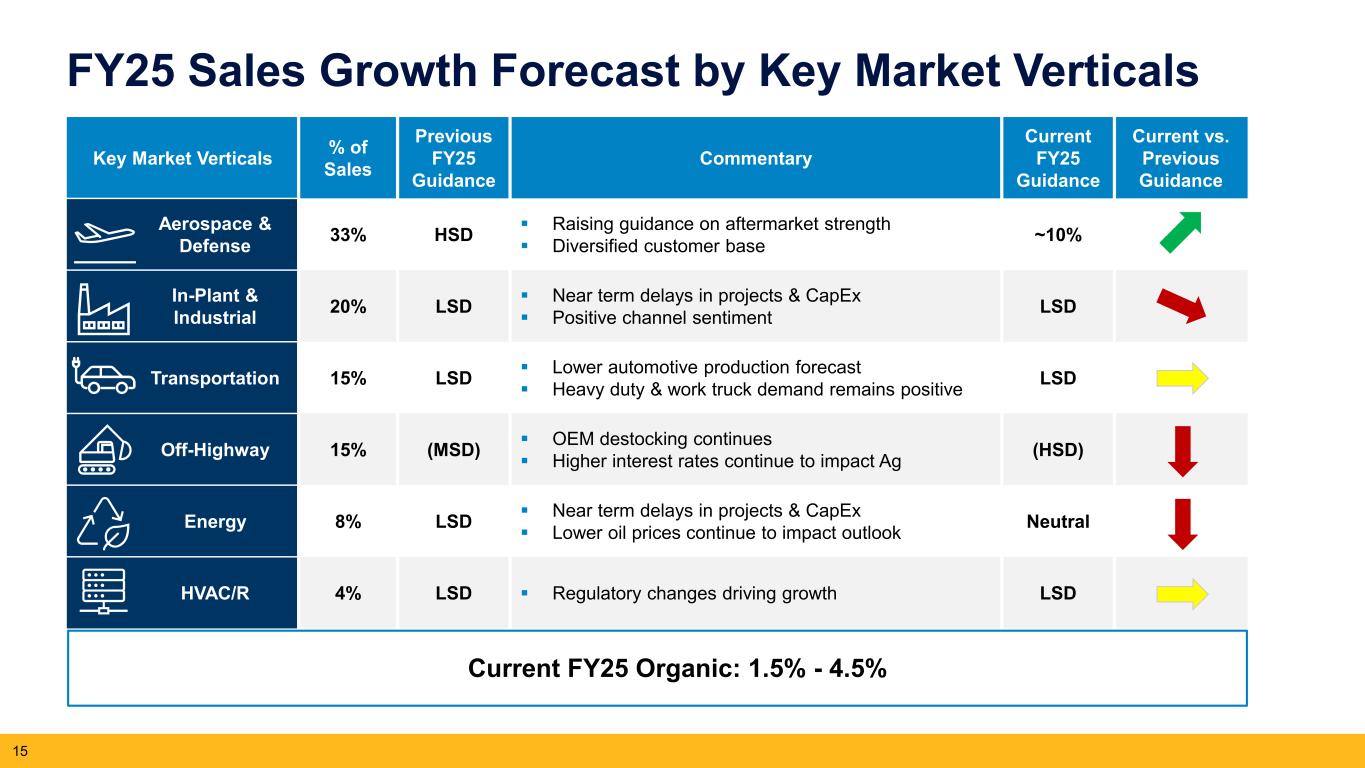
Key Market Verticals % of Sales Previous FY25 Guidance Commentary Current FY25 Guidance Current vs. Previous Guidance Aerospace & Defense 33% HSD Raising guidance on aftermarket strength Diversified customer base ~10% In-Plant & Industrial 20% LSD Near term delays in projects & CapEx Positive channel sentiment LSD Transportation 15% LSD Lower automotive production forecast Heavy duty & work truck demand remains positive LSD Off-Highway 15% (MSD) OEM destocking continues Higher interest rates continue to impact Ag (HSD) Energy 8% LSD Near term delays in projects & CapEx Lower oil prices continue to impact outlook Neutral HVAC/R 4% LSD Regulatory changes driving growth LSD 15 FY25 Sales Growth Forecast by Key Market Verticals Current FY25 Organic: 1.5% - 4.5%
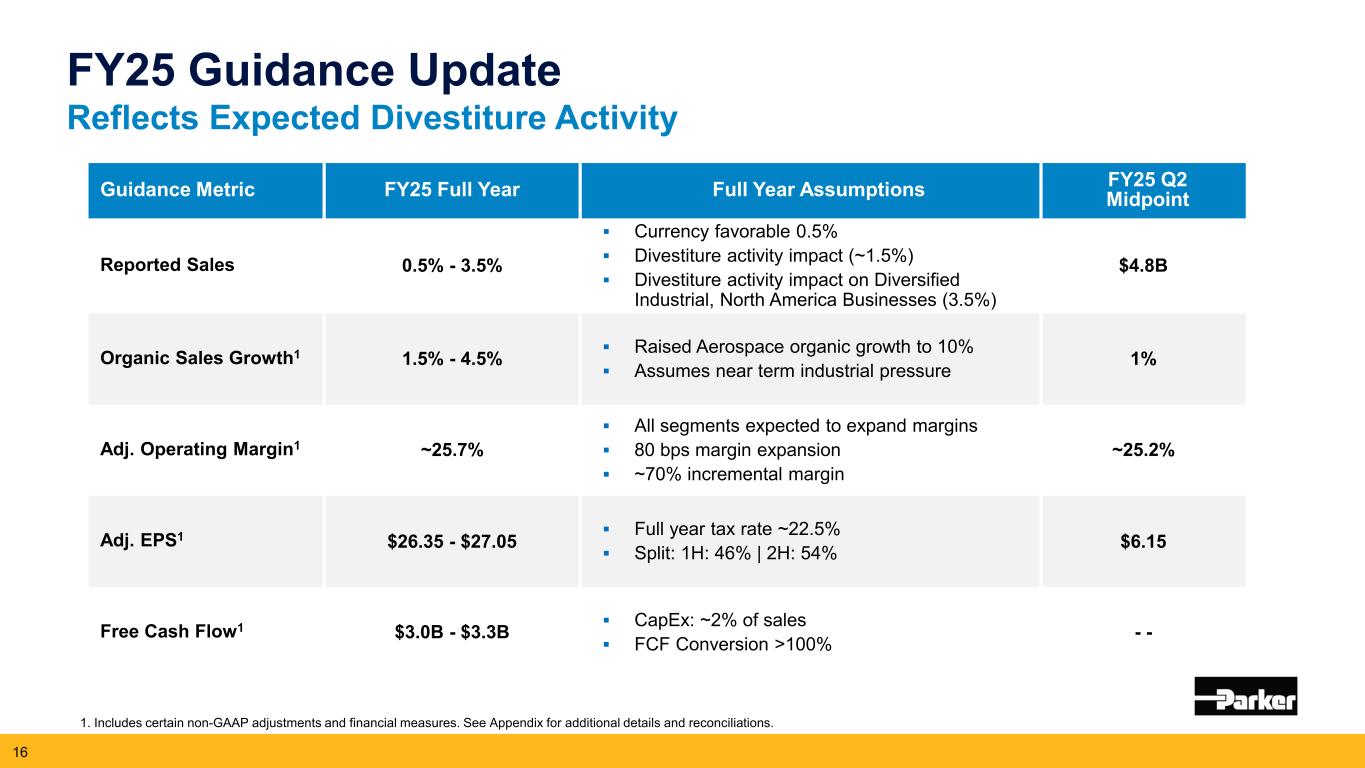
FY25 Guidance Update Reflects Expected Divestiture Activity 1. Includes certain non-GAAP adjustments and financial measures. See Appendix for additional details and reconciliations. 16 Guidance Metric FY25 Full Year Full Year Assumptions FY25 Q2 Midpoint Reported Sales 0.5% - 3.5% Currency favorable 0.5% Divestiture activity impact (~1.5%) Divestiture activity impact on Diversified Industrial, North America Businesses (3.5%) $4.8B Organic Sales Growth1 1.5% - 4.5% Raised Aerospace organic growth to 10% Assumes near term industrial pressure 1% Adj. Operating Margin1 ~25.7% All segments expected to expand margins 80 bps margin expansion ~70% incremental margin ~25.2% Adj. EPS1 $26.35 - $27.05 Full year tax rate ~22.5% Split: 1H: 46% | 2H: 54% $6.15 Free Cash Flow1 $3.0B - $3.3B CapEx: ~2% of sales FCF Conversion >100% - -
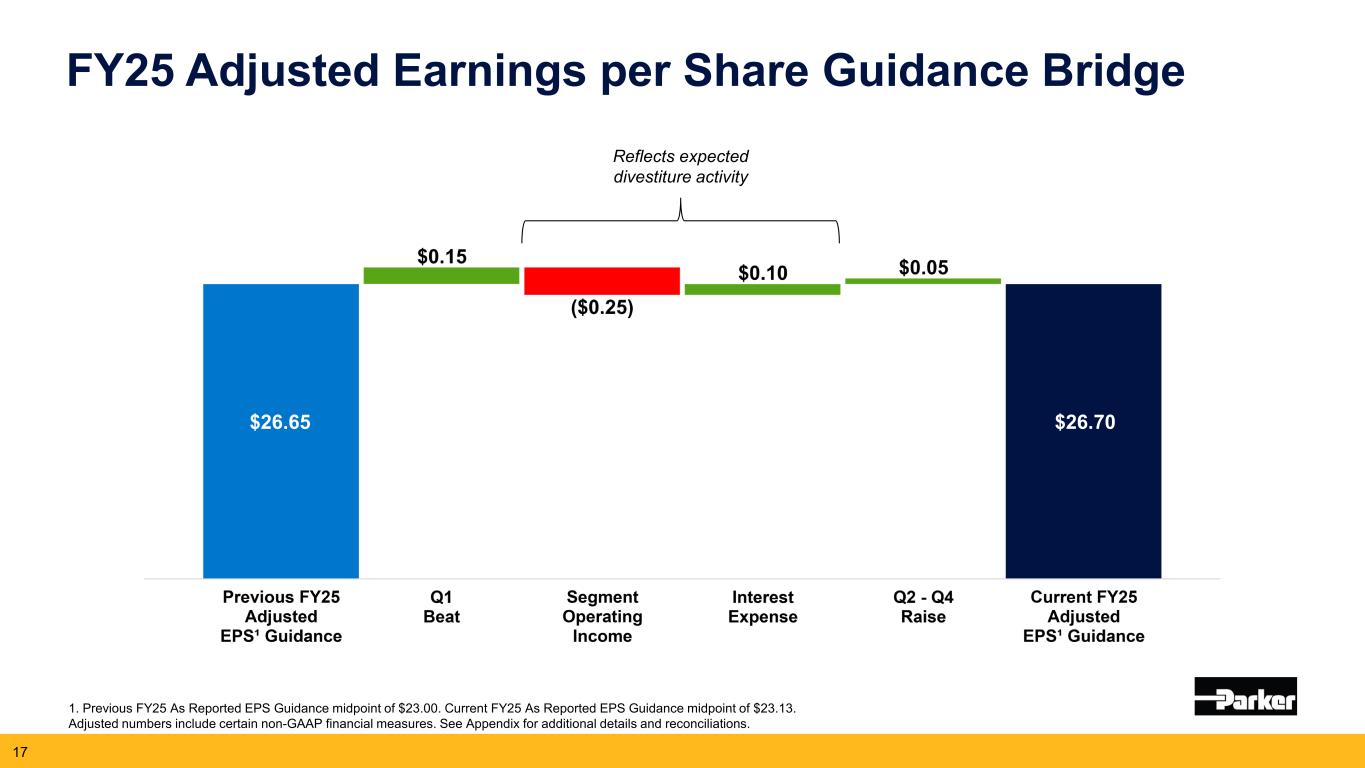
FY25 Adjusted Earnings per Share Guidance Bridge 1. Previous FY25 As Reported EPS Guidance midpoint of $23.00. Current FY25 As Reported EPS Guidance midpoint of $23.13. Adjusted numbers include certain non-GAAP financial measures. See Appendix for additional details and reconciliations. 17 $26.65 $26.70 Reflects expected divestiture activity
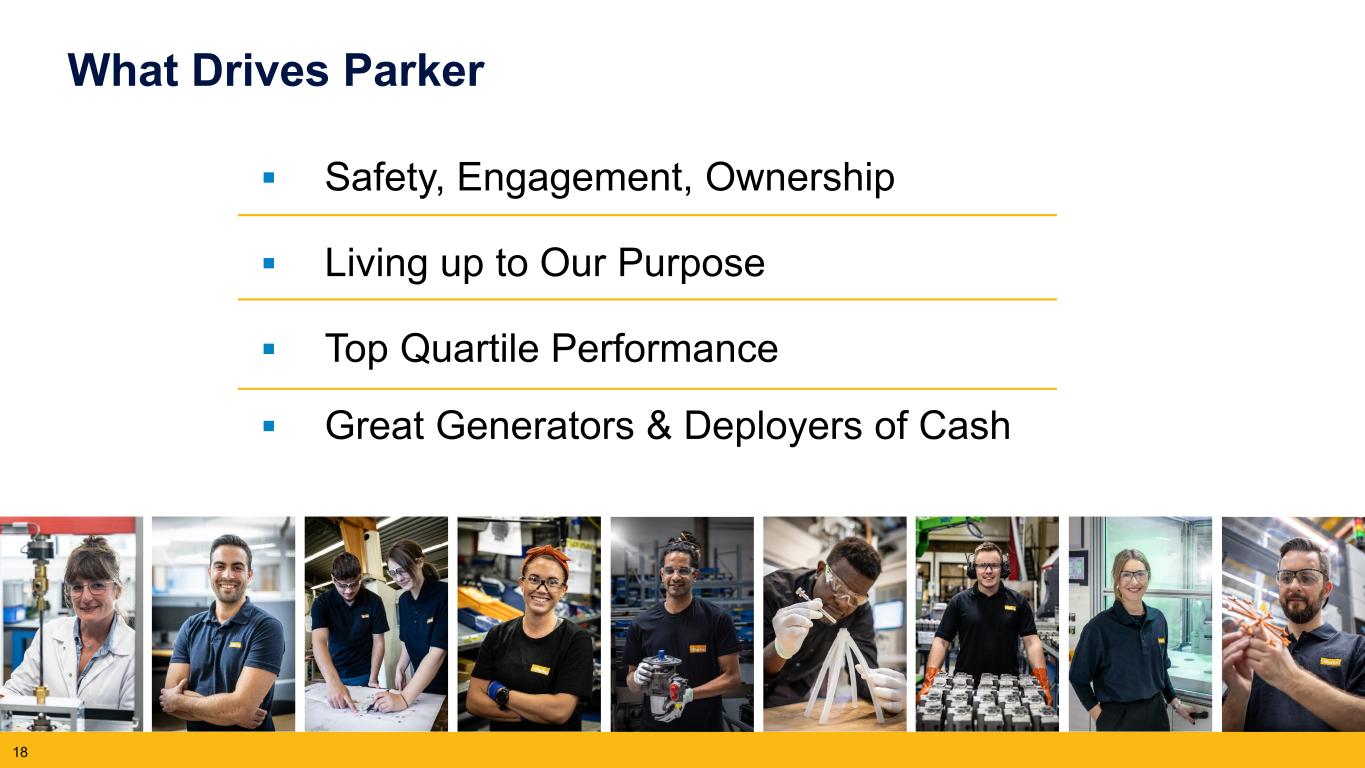
What Drives Parker Safety, Engagement, Ownership Living up to Our Purpose Top Quartile Performance Great Generators & Deployers of Cash 18

Upcoming Event Calendar FY25 Q2 Earnings Release January 30, 2025 FY25 Q3 Earnings Release May 1, 2025 FY25 Q4 Earnings Release August 7, 2025
Appendix FY25 Guidance Details Reconciliation of Organic Growth Adjusted Amounts Reconciliation – Consolidated Adjusted Amounts Reconciliation – Segment Operating Income Reconciliation of EBITDA to Adjusted EBITDA Reconciliation of Net Debt to Adjusted EBITDA Reconciliation of Free Cash Flow Margin Supplemental Sales Information – Global Technology Platforms Reconciliation of FY25 Guidance 20
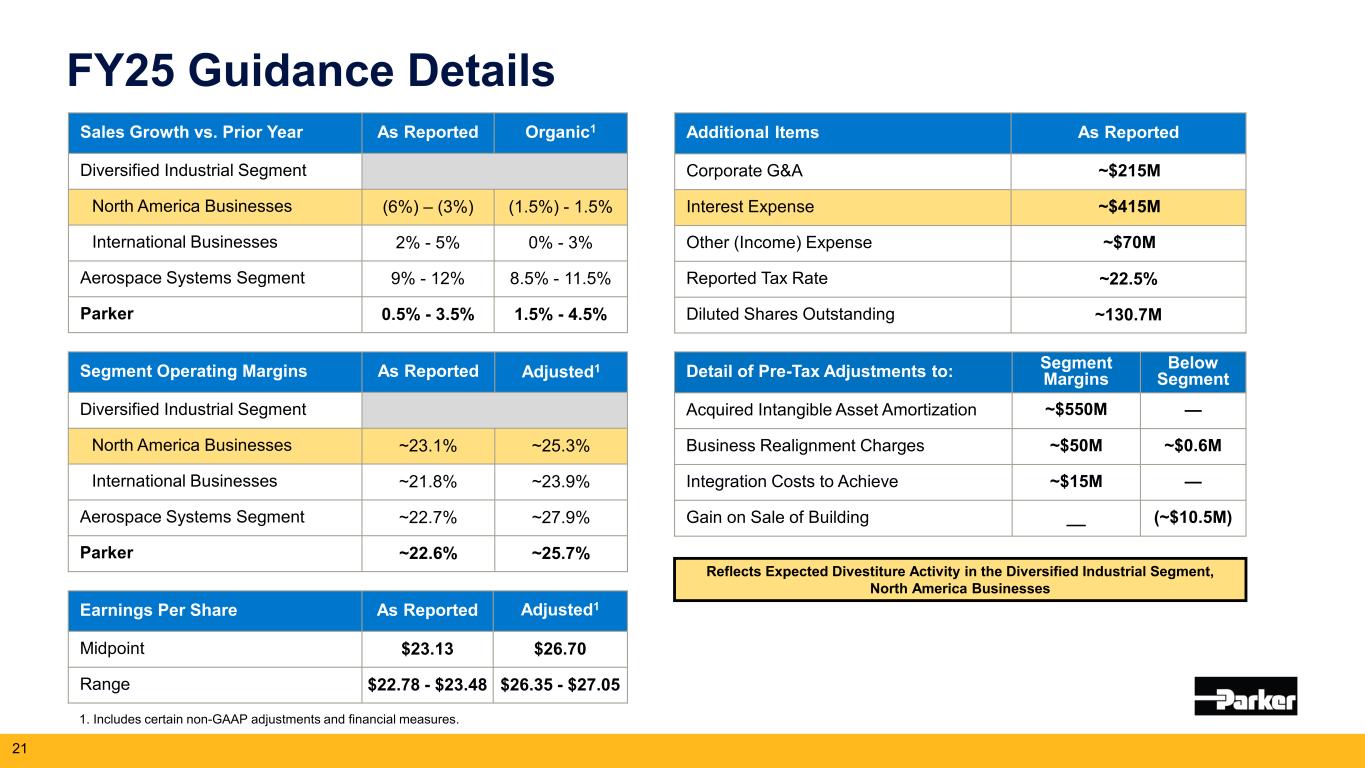
FY25 Guidance Details Sales Growth vs. Prior Year As Reported Organic1 Diversified Industrial Segment North America Businesses (6%) – (3%) (1.5%) - 1.5% International Businesses 2% - 5% 0% - 3% Aerospace Systems Segment 9% - 12% 8.5% - 11.5% Parker 0.5% - 3.5% 1.5% - 4.5% Segment Operating Margins As Reported Adjusted1 Diversified Industrial Segment North America Businesses ~23.1% ~25.3% International Businesses ~21.8% ~23.9% Aerospace Systems Segment ~22.7% ~27.9% Parker ~22.6% ~25.7% Earnings Per Share As Reported Adjusted1 Midpoint $23.13 $26.70 Range $22.78 - $23.48 $26.35 - $27.05 1. Includes certain non-GAAP adjustments and financial measures. Detail of Pre-Tax Adjustments to: Segment Margins Below Segment Acquired Intangible Asset Amortization ~$550M — Business Realignment Charges ~$50M ~$0.6M Integration Costs to Achieve ~$15M — Gain on Sale of Building __ (~$10.5M) 21 Additional Items As Reported Corporate G&A ~$215M Interest Expense ~$415M Other (Income) Expense ~$70M Reported Tax Rate ~22.5% Diluted Shares Outstanding ~130.7M Reflects Expected Divestiture Activity in the Diversified Industrial Segment, North America Businesses
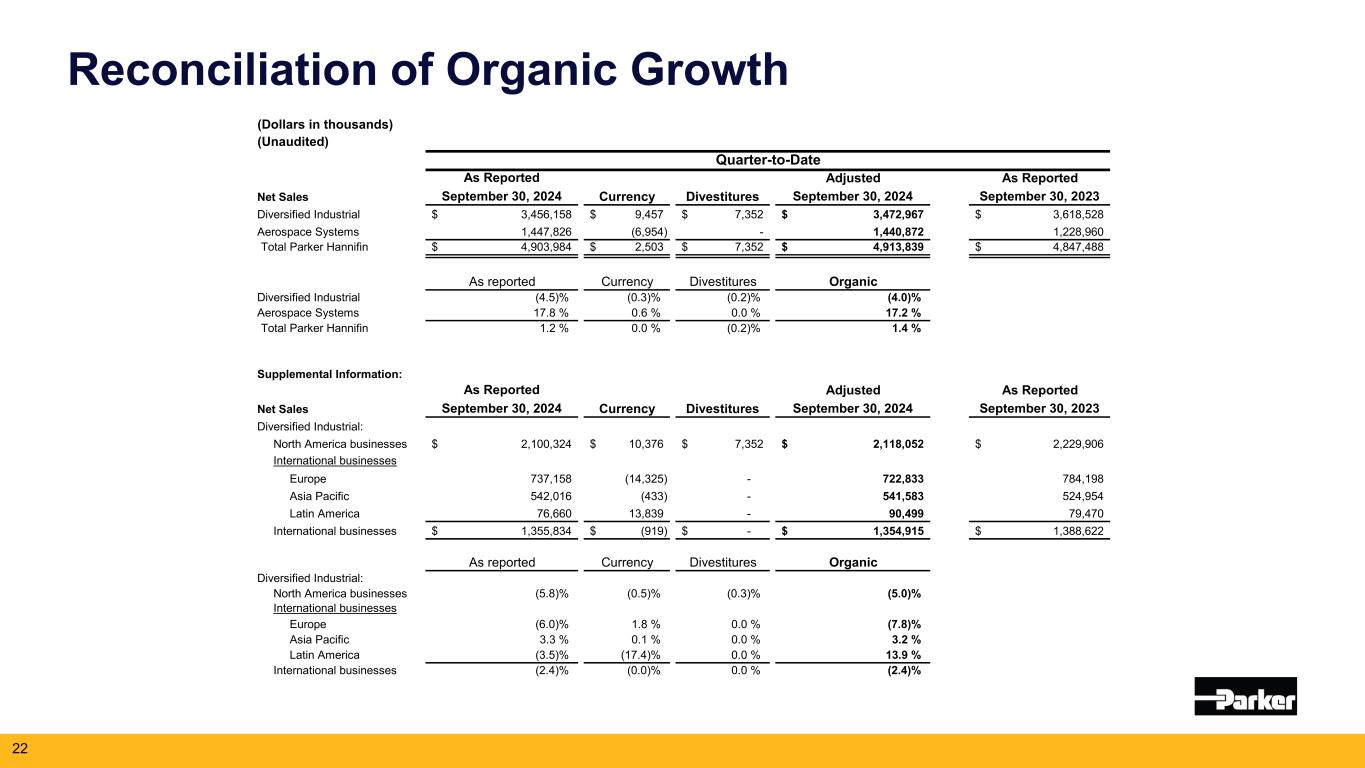
Reconciliation of Organic Growth 22 (Dollars in thousands) (Unaudited) Quarter-to-Date As Reported Adjusted As Reported Net Sales September 30, 2024 September 30, 2024 September 30, 2023 Diversified Industrial 3,456,158$ 9,457$ 7,352$ 3,472,967$ 3,618,528$ Aerospace Systems 1,447,826 (6,954) - 1,440,872 1,228,960 Total Parker Hannifin 4,903,984$ 2,503$ 7,352$ 4,913,839$ 4,847,488$ As reported Currency Divestitures Organic Diversified Industrial (4.5)% (0.3)% (0.2)% (4.0)% Aerospace Systems 17.8 % 0.6 % 0.0 % 17.2 % Total Parker Hannifin 1.2 % 0.0 % (0.2)% 1.4 % Supplemental Information: As Reported Adjusted As Reported Net Sales September 30, 2024 September 30, 2024 September 30, 2023 Diversified Industrial: North America businesses 2,100,324$ 10,376$ 7,352$ 2,118,052$ 2,229,906$ International businesses Europe 737,158 (14,325) - 722,833 784,198 Asia Pacific 542,016 (433) - 541,583 524,954 Latin America 76,660 13,839 - 90,499 79,470 International businesses 1,355,834$ (919)$ -$ 1,354,915$ 1,388,622$ As reported Currency Divestitures Organic Diversified Industrial: North America businesses (5.8)% (0.5)% (0.3)% (5.0)% International businesses Europe (6.0)% 1.8 % 0.0 % (7.8)% Asia Pacific 3.3 % 0.1 % 0.0 % 3.2 % Latin America (3.5)% (17.4)% 0.0 % 13.9 % International businesses (2.4)% (0.0)% 0.0 % (2.4)% Currency Divestitures Currency Divestitures
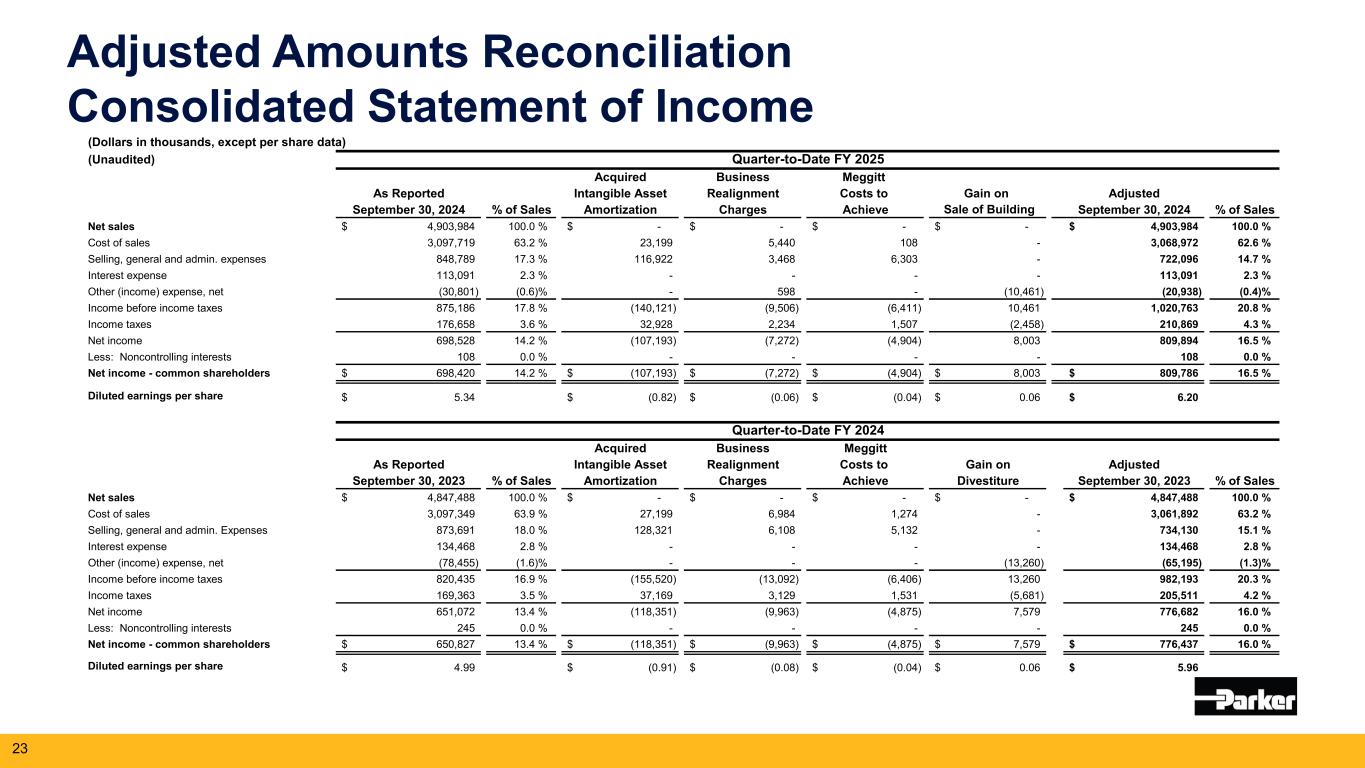
Adjusted Amounts Reconciliation Consolidated Statement of Income 23 (Dollars in thousands, except per share data) (Unaudited) Quarter-to-Date FY 2025 Acquired Business Meggitt As Reported Intangible Asset Realignment Costs to Gain on Adjusted September 30, 2024 % of Sales Amortization Charges Achieve Sale of Building September 30, 2024 % of Sales Net sales 4,903,984$ 100.0 % -$ -$ -$ -$ 4,903,984$ 100.0 % Cost of sales 3,097,719 63.2 % 23,199 5,440 108 - 3,068,972 62.6 % Selling, general and admin. expenses 848,789 17.3 % 116,922 3,468 6,303 - 722,096 14.7 % Interest expense 113,091 2.3 % - - - - 113,091 2.3 % Other (income) expense, net (30,801) (0.6)% - 598 - (10,461) (20,938) (0.4)% Income before income taxes 875,186 17.8 % (140,121) (9,506) (6,411) 10,461 1,020,763 20.8 % Income taxes 176,658 3.6 % 32,928 2,234 1,507 (2,458) 210,869 4.3 % Net income 698,528 14.2 % (107,193) (7,272) (4,904) 8,003 809,894 16.5 % Less: Noncontrolling interests 108 0.0 % - - - - 108 0.0 % Net income - common shareholders 698,420$ 14.2 % (107,193)$ (7,272)$ (4,904)$ 8,003$ 809,786$ 16.5 % Diluted earnings per share 5.34$ (0.82)$ (0.06)$ (0.04)$ 0.06$ 6.20$ Quarter-to-Date FY 2024 Acquired Business Meggitt As Reported Intangible Asset Realignment Costs to Gain on Adjusted September 30, 2023 % of Sales Amortization Charges Achieve Divestiture September 30, 2023 % of Sales Net sales 4,847,488$ 100.0 % -$ -$ -$ -$ 4,847,488$ 100.0 % Cost of sales 3,097,349 63.9 % 27,199 6,984 1,274 - 3,061,892 63.2 % Selling, general and admin. Expenses 873,691 18.0 % 128,321 6,108 5,132 - 734,130 15.1 % Interest expense 134,468 2.8 % - - - - 134,468 2.8 % Other (income) expense, net (78,455) (1.6)% - - - (13,260) (65,195) (1.3)% Income before income taxes 820,435 16.9 % (155,520) (13,092) (6,406) 13,260 982,193 20.3 % Income taxes 169,363 3.5 % 37,169 3,129 1,531 (5,681) 205,511 4.2 % Net income 651,072 13.4 % (118,351) (9,963) (4,875) 7,579 776,682 16.0 % Less: Noncontrolling interests 245 0.0 % - - - - 245 0.0 % Net income - common shareholders 650,827$ 13.4 % (118,351)$ (9,963)$ (4,875)$ 7,579$ 776,437$ 16.0 % Diluted earnings per share 4.99$ (0.91)$ (0.08)$ (0.04)$ 0.06$ 5.96$
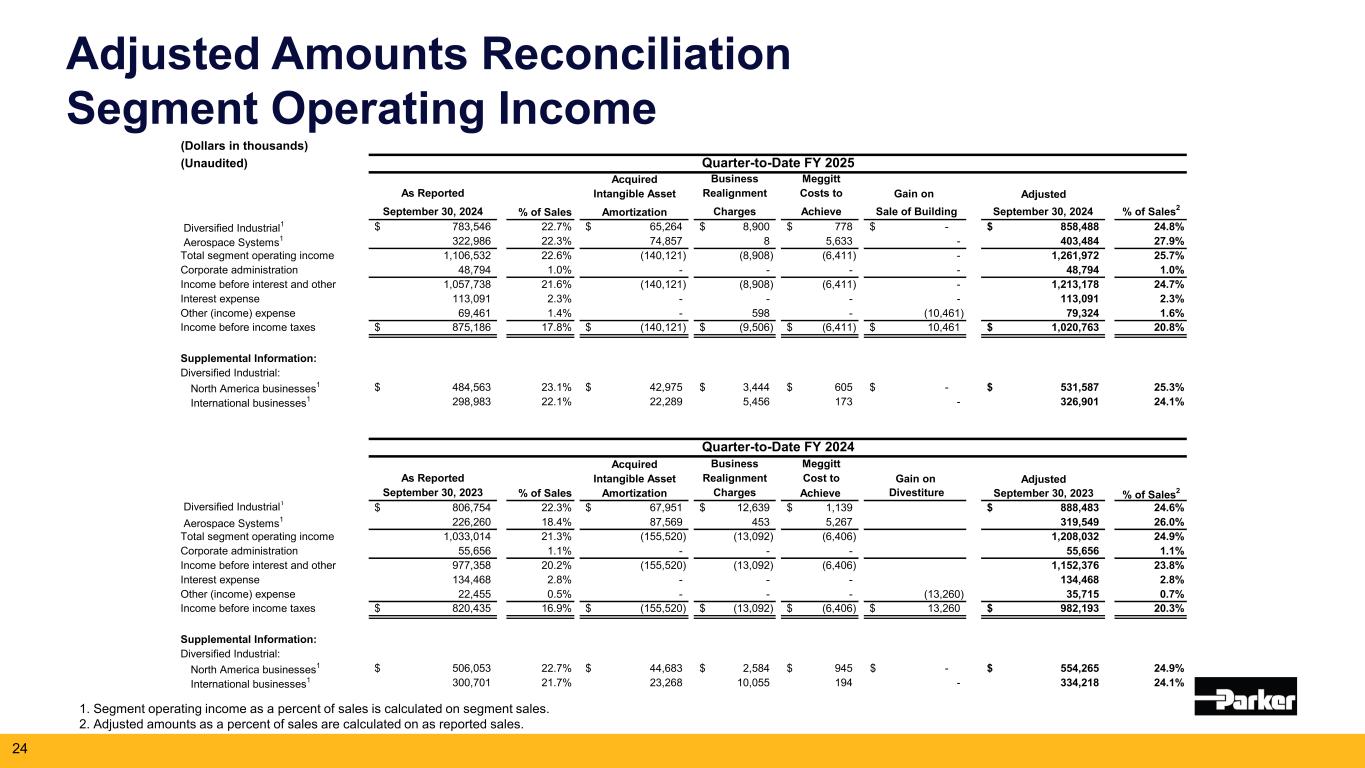
Adjusted Amounts Reconciliation Segment Operating Income 1. Segment operating income as a percent of sales is calculated on segment sales. 2. Adjusted amounts as a percent of sales are calculated on as reported sales. 24 (Dollars in thousands) (Unaudited) Quarter-to-Date FY 2025 Acquired Business Meggitt As Reported Intangible Asset Realignment Costs to Gain on Adjusted September 30, 2024 % of Sales Amortization Charges Achieve Sale of Building September 30, 2024 % of Sales2 Diversified Industrial1 783,546$ 22.7% 65,264$ 8,900$ 778$ -$ 858,488$ 24.8% Aerospace Systems1 322,986 22.3% 74,857 8 5,633 - 403,484 27.9% Total segment operating income 1,106,532 22.6% (140,121) (8,908) (6,411) - 1,261,972 25.7% Corporate administration 48,794 1.0% - - - - 48,794 1.0% Income before interest and other 1,057,738 21.6% (140,121) (8,908) (6,411) - 1,213,178 24.7% Interest expense 113,091 2.3% - - - - 113,091 2.3% Other (income) expense 69,461 1.4% - 598 - (10,461) 79,324 1.6% Income before income taxes 875,186$ 17.8% (140,121)$ (9,506)$ (6,411)$ 10,461$ 1,020,763$ 20.8% Supplemental Information: Diversified Industrial: North America businesses1 484,563$ 23.1% 42,975$ 3,444$ 605$ -$ 531,587$ 25.3% International businesses1 298,983 22.1% 22,289 5,456 173 - 326,901 24.1% Quarter-to-Date FY 2024 Acquired Business Meggitt As Reported Intangible Asset Realignment Cost to Gain on Adjusted September 30, 2023 % of Sales Amortization Charges Achieve Divestiture September 30, 2023 % of Sales2 Diversified Industrial1 806,754$ 22.3% 67,951$ 12,639$ 1,139$ 888,483$ 24.6% Aerospace Systems1 226,260 18.4% 87,569 453 5,267 319,549 26.0% Total segment operating income 1,033,014 21.3% (155,520) (13,092) (6,406) 1,208,032 24.9% Corporate administration 55,656 1.1% - - - 55,656 1.1% Income before interest and other 977,358 20.2% (155,520) (13,092) (6,406) 1,152,376 23.8% Interest expense 134,468 2.8% - - - 134,468 2.8% Other (income) expense 22,455 0.5% - - - (13,260) 35,715 0.7% Income before income taxes 820,435$ 16.9% (155,520)$ (13,092)$ (6,406)$ 13,260$ 982,193$ 20.3% Supplemental Information: Diversified Industrial: North America businesses1 506,053$ 22.7% 44,683$ 2,584$ 945$ -$ 554,265$ 24.9% International businesses1 300,701 21.7% 23,268 10,055 194 - 334,218 24.1%
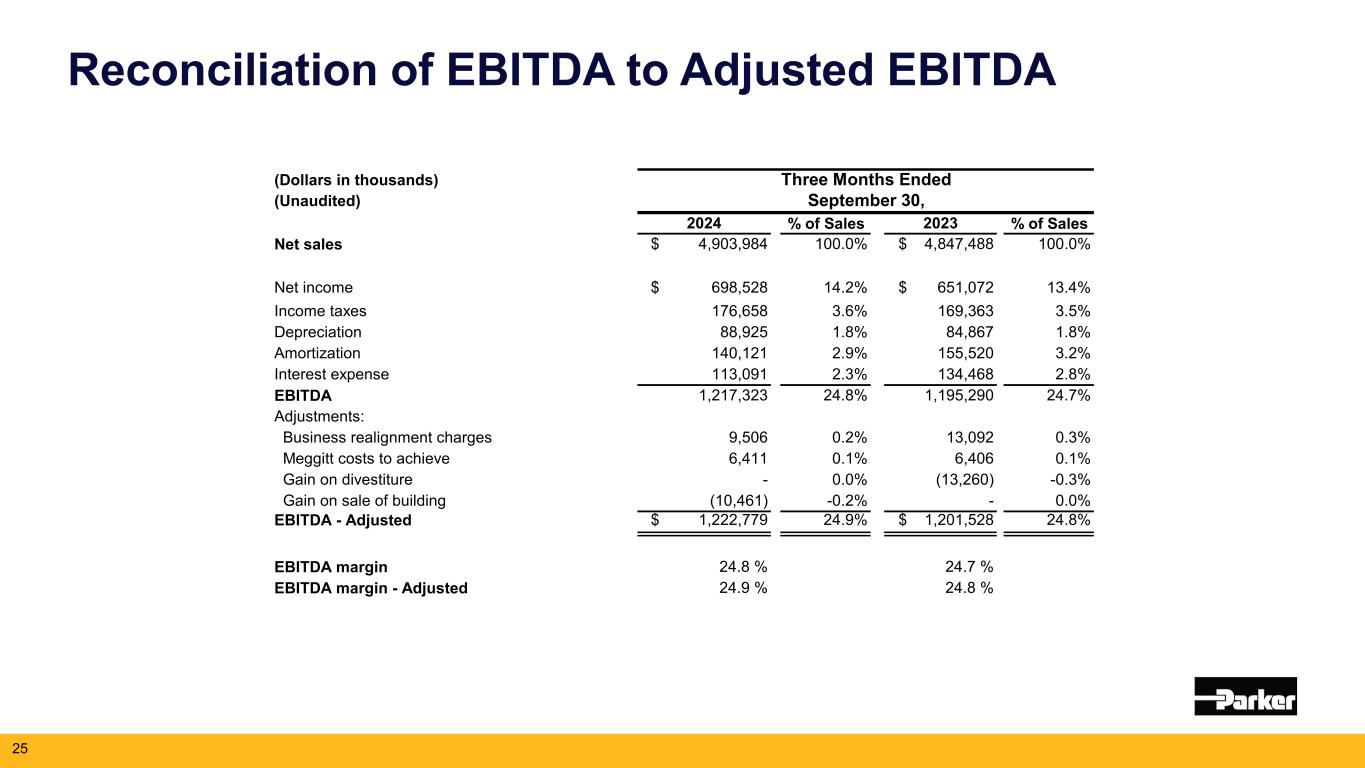
Reconciliation of EBITDA to Adjusted EBITDA 25 (Dollars in thousands) Three Months Ended (Unaudited) September 30, 2024 % of Sales 2023 % of Sales Net sales $ 4,903,984 100.0% $ 4,847,488 100.0% Net income $ 698,528 14.2% $ 651,072 13.4% Income taxes 176,658 3.6% 169,363 3.5% Depreciation 88,925 1.8% 84,867 1.8% Amortization 140,121 2.9% 155,520 3.2% Interest expense 113,091 2.3% 134,468 2.8% EBITDA 1,217,323 24.8% 1,195,290 24.7% Adjustments: Business realignment charges 9,506 0.2% 13,092 0.3% Meggitt costs to achieve 6,411 0.1% 6,406 0.1% Gain on divestiture - 0.0% (13,260) -0.3% Gain on sale of building (10,461) -0.2% - 0.0% EBITDA - Adjusted $ 1,222,779 24.9% $ 1,201,528 24.8% EBITDA margin 24.8 % 24.7 % EBITDA margin - Adjusted 24.9 % 24.8 %
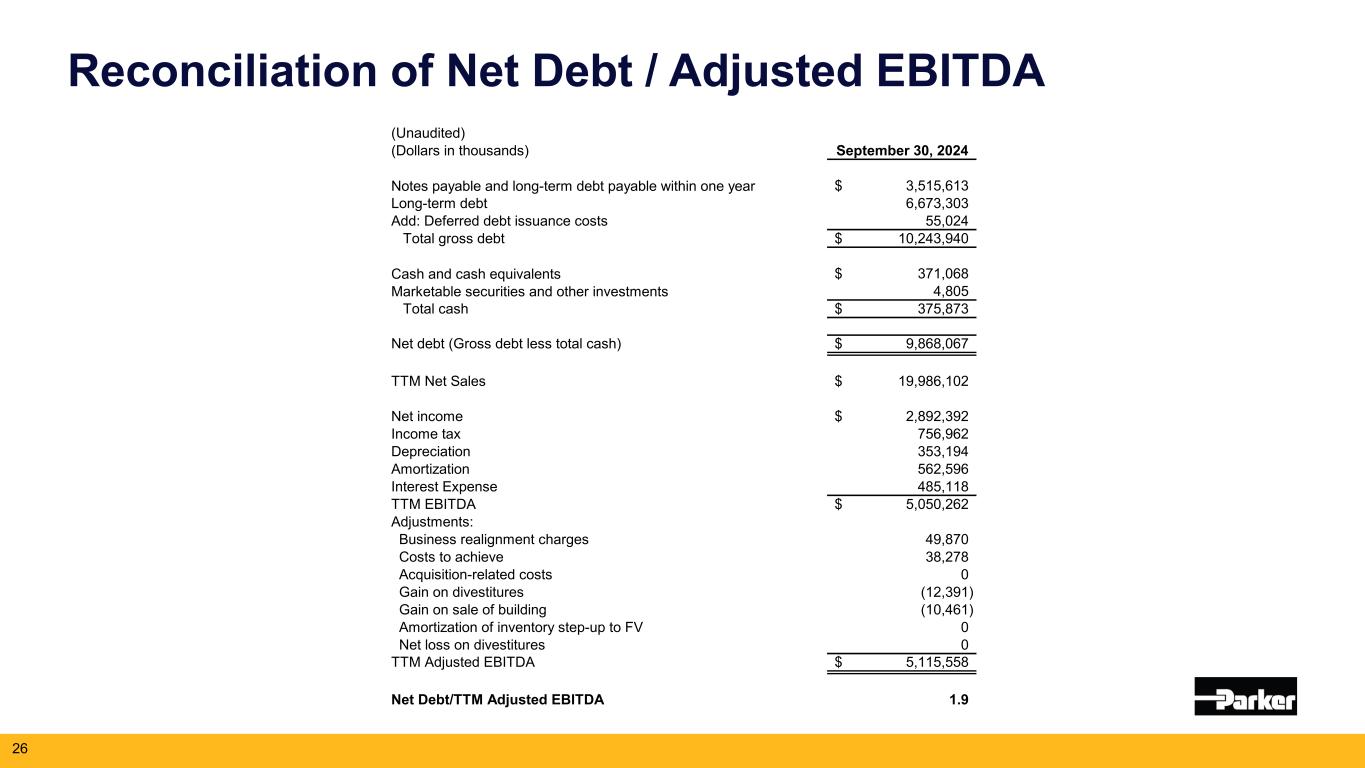
Reconciliation of Net Debt / Adjusted EBITDA 26 (Unaudited) (Dollars in thousands) September 30, 2024 Notes payable and long-term debt payable within one year 3,515,613$ Long-term debt 6,673,303 Add: Deferred debt issuance costs 55,024 Total gross debt 10,243,940$ Cash and cash equivalents 371,068$ Marketable securities and other investments 4,805 Total cash 375,873$ Net debt (Gross debt less total cash) 9,868,067$ TTM Net Sales 19,986,102$ Net income 2,892,392$ Income tax 756,962 Depreciation 353,194 Amortization 562,596 Interest Expense 485,118 TTM EBITDA 5,050,262$ Adjustments: Business realignment charges 49,870 Costs to achieve 38,278 Acquisition-related costs 0 Gain on divestitures (12,391) Gain on sale of building (10,461) Amortization of inventory step-up to FV 0 Net loss on divestitures 0 TTM Adjusted EBITDA 5,115,558$ Net Debt/TTM Adjusted EBITDA 1.9
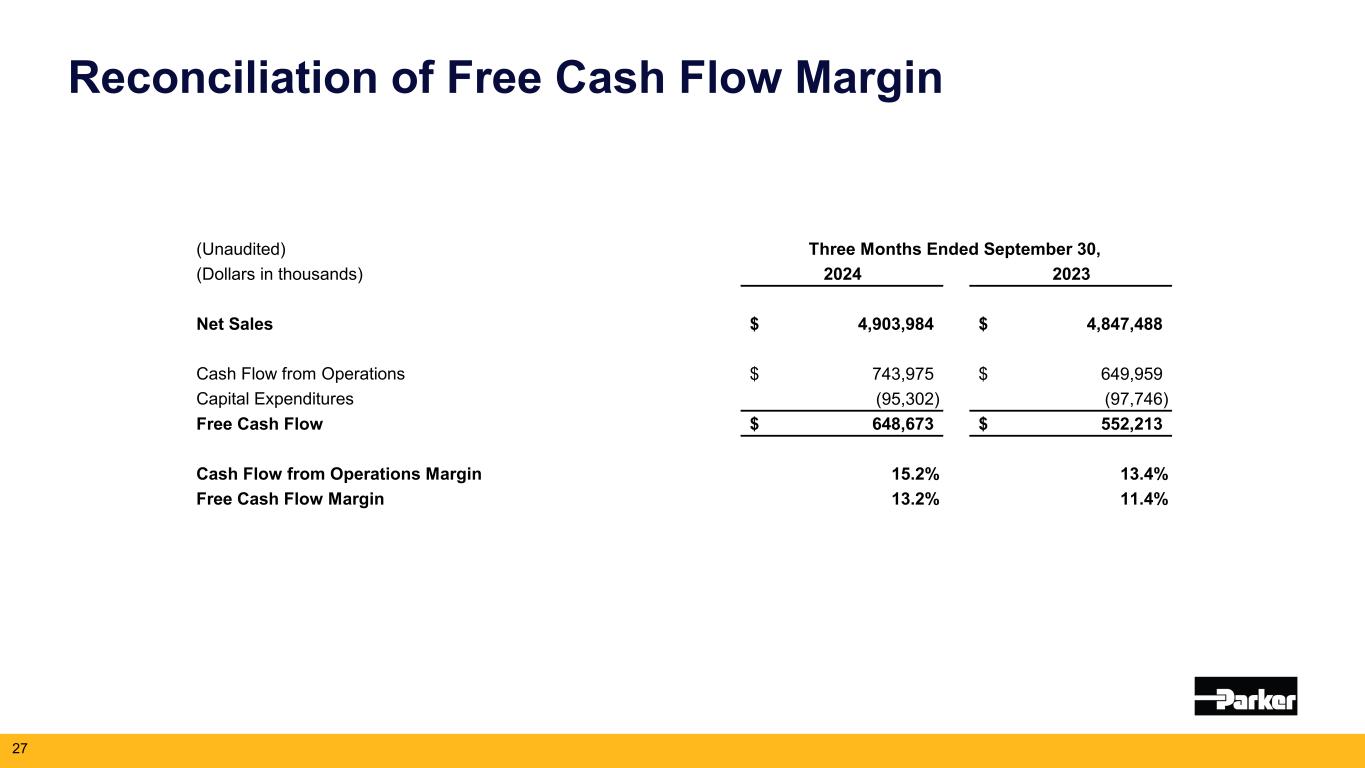
Reconciliation of Free Cash Flow Margin 27 (Unaudited) (Dollars in thousands) 2024 2023 Net Sales 4,903,984$ 4,847,488$ Cash Flow from Operations 743,975$ 649,959$ Capital Expenditures (95,302) (97,746) Free Cash Flow 648,673$ 552,213$ Cash Flow from Operations Margin 15.2% 13.4% Free Cash Flow Margin 13.2% 11.4% Three Months Ended September 30,
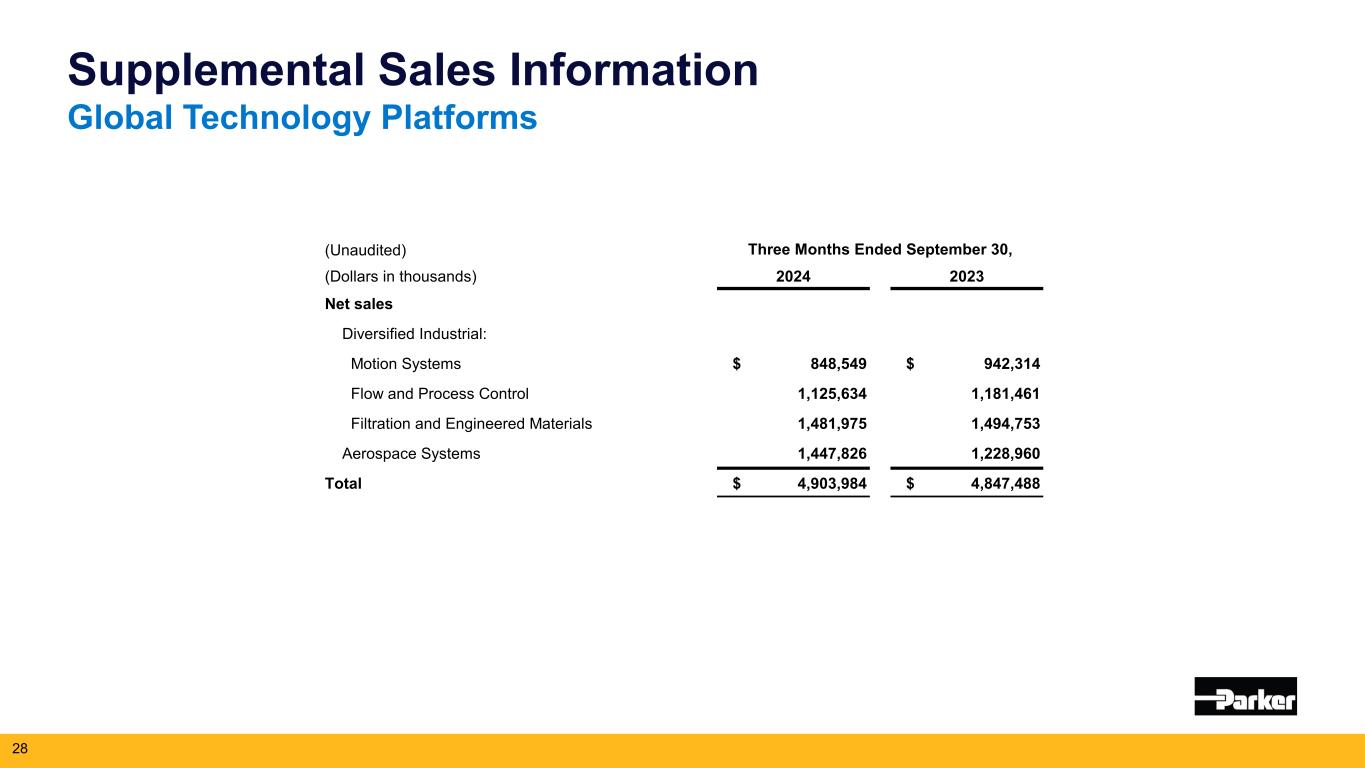
Supplemental Sales Information Global Technology Platforms 28 (Unaudited) (Dollars in thousands) 2024 2023 Net sales Diversified Industrial: Motion Systems $ 848,549 $ 942,314 Flow and Process Control 1,125,634 1,181,461 Filtration and Engineered Materials 1,481,975 1,494,753 Aerospace Systems 1,447,826 1,228,960 Total $ 4,903,984 $ 4,847,488 Three Months Ended September 30,
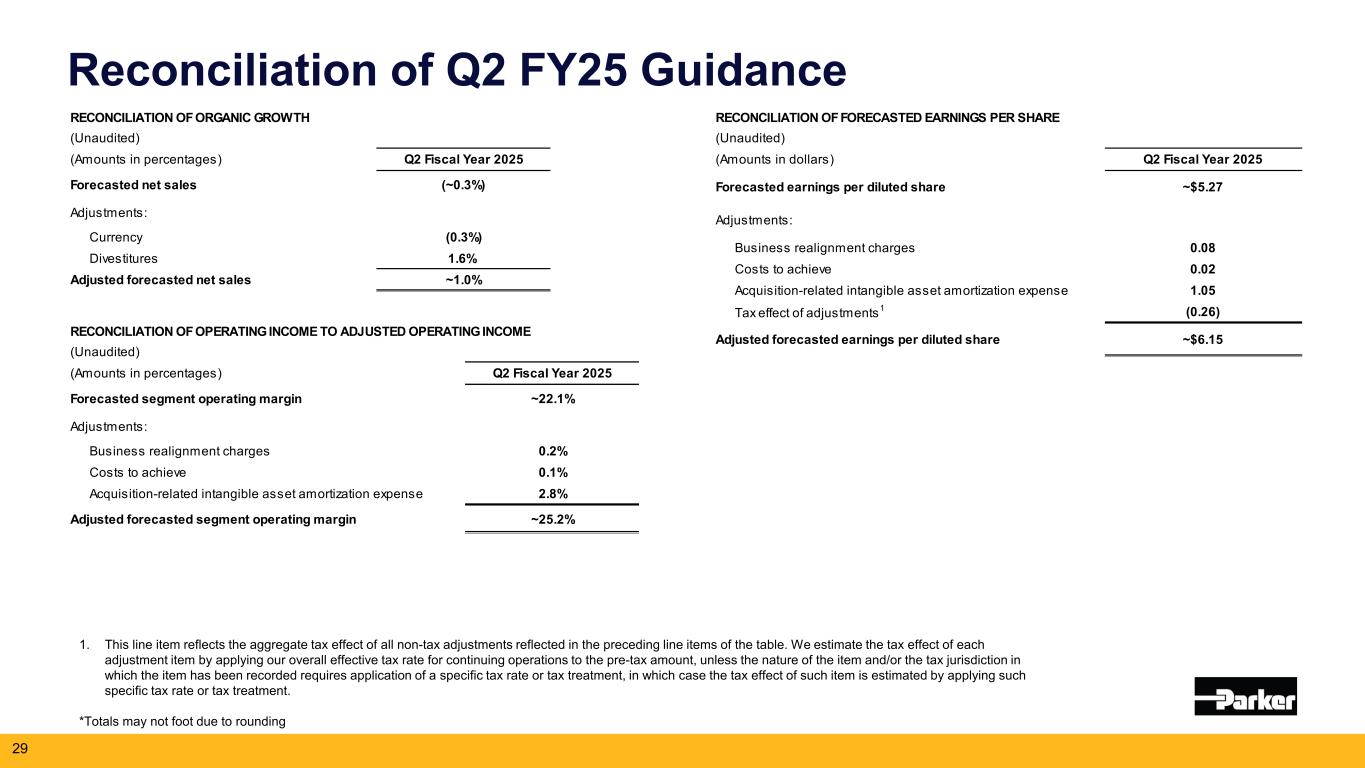
RECONCILIATION OF FORECASTED EARNINGS PER SHARE (Unaudited) (Amounts in dollars) Q2 Fiscal Year 2025 Forecasted earnings per diluted share ~$5.27 Adjustments: Business realignment charges 0.08 Costs to achieve 0.02 Acquisition-related intangible asset amortization expense 1.05 Tax effect of adjustments1 (0.26) Adjusted forecasted earnings per diluted share ~$6.15RECONCILIATION OF OPERATING INCOME TO ADJUSTED OPERATING INCOME (Unaudited) (Amounts in percentages) Q2 Fiscal Year 2025 Forecasted segment operating margin ~22.1% Adjustments: Business realignment charges 0.2% Costs to achieve 0.1% Acquisition-related intangible asset amortization expense 2.8% Adjusted forecasted segment operating margin ~25.2% RECONCILIATION OF ORGANIC GROWTH (Unaudited) (Amounts in percentages) Q2 Fiscal Year 2025 Forecasted net sales (~0.3%) Adjustments: Currency (0.3%) Divestitures 1.6% Adjusted forecasted net sales ~1.0% Reconciliation of Q2 FY25 Guidance 1. This line item reflects the aggregate tax effect of all non-tax adjustments reflected in the preceding line items of the table. We estimate the tax effect of each adjustment item by applying our overall effective tax rate for continuing operations to the pre-tax amount, unless the nature of the item and/or the tax jurisdiction in which the item has been recorded requires application of a specific tax rate or tax treatment, in which case the tax effect of such item is estimated by applying such specific tax rate or tax treatment. *Totals may not foot due to rounding 29
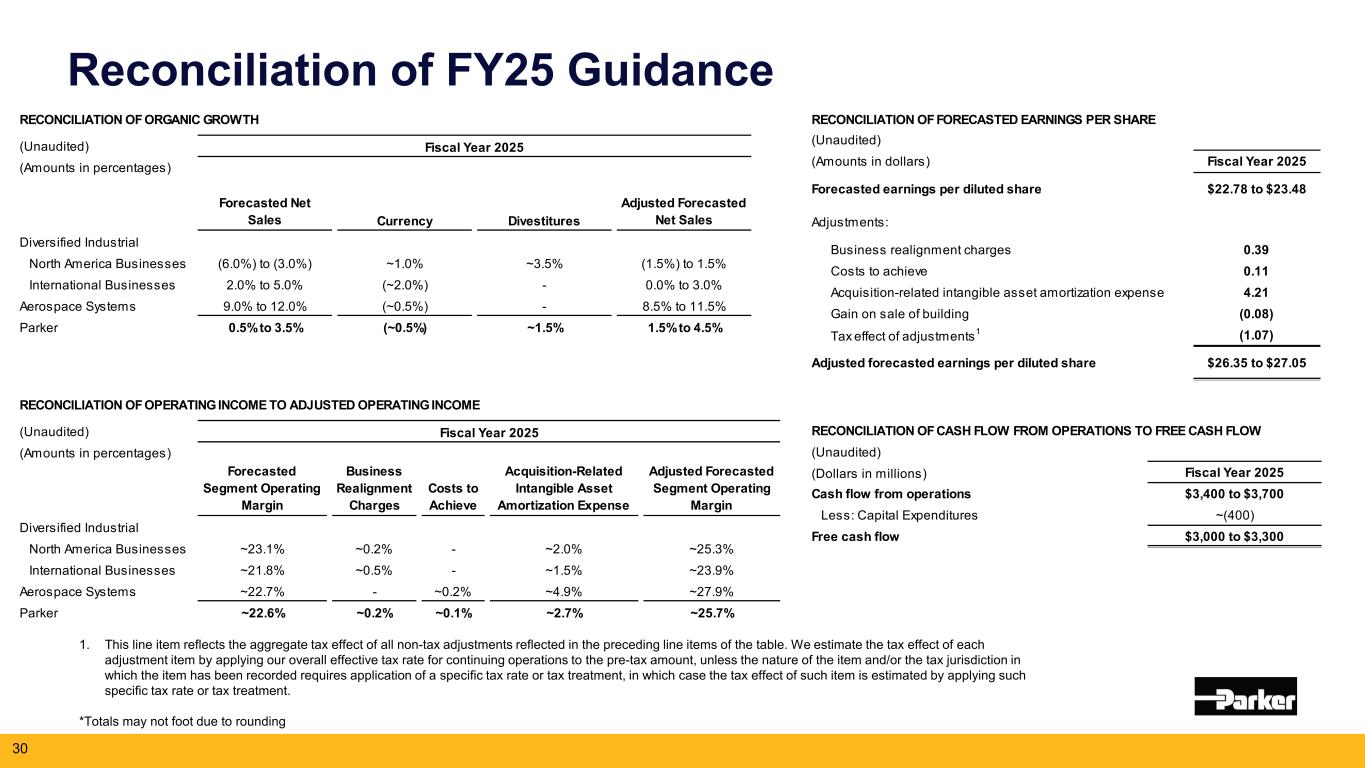
RECONCILIATION OF CASH FLOW FROM OPERATIONS TO FREE CASH FLOW (Unaudited) (Dollars in millions) Fiscal Year 2025 Cash flow from operations $3,400 to $3,700 Less: Capital Expenditures ~(400) Free cash flow $3,000 to $3,300 RECONCILIATION OF FORECASTED EARNINGS PER SHARE (Unaudited) (Amounts in dollars) Fiscal Year 2025 Forecasted earnings per diluted share $22.78 to $23.48 Adjustments: Business realignment charges 0.39 Costs to achieve 0.11 Acquisition-related intangible asset amortization expense 4.21 Gain on sale of building (0.08) Tax effect of adjustments1 (1.07) Adjusted forecasted earnings per diluted share $26.35 to $27.05 RECONCILIATION OF OPERATING INCOME TO ADJUSTED OPERATING INCOME (Unaudited) Fiscal Year 2025 (Amounts in percentages) Forecasted Segment Operating Margin Business Realignment Charges Costs to Achieve Acquisition-Related Intangible Asset Amortization Expense Adjusted Forecasted Segment Operating Margin Diversified Industrial North America Businesses ~23.1% ~0.2% - ~2.0% ~25.3% International Businesses ~21.8% ~0.5% - ~1.5% ~23.9% Aerospace Systems ~22.7% - ~0.2% ~4.9% ~27.9% Parker ~22.6% ~0.2% ~0.1% ~2.7% ~25.7% RECONCILIATION OF ORGANIC GROWTH (Unaudited) Fiscal Year 2025 (Amounts in percentages) Forecasted Net Sales Currency Divestitures Adjusted Forecasted Net Sales Diversified Industrial North America Businesses (6.0%) to (3.0%) ~1.0% ~3.5% (1.5%) to 1.5% International Businesses 2.0% to 5.0% (~2.0%) - 0.0% to 3.0% Aerospace Systems 9.0% to 12.0% (~0.5%) - 8.5% to 11.5% Parker 0.5% to 3.5% (~0.5%) ~1.5% 1.5% to 4.5% Reconciliation of FY25 Guidance 1. This line item reflects the aggregate tax effect of all non-tax adjustments reflected in the preceding line items of the table. We estimate the tax effect of each adjustment item by applying our overall effective tax rate for continuing operations to the pre-tax amount, unless the nature of the item and/or the tax jurisdiction in which the item has been recorded requires application of a specific tax rate or tax treatment, in which case the tax effect of such item is estimated by applying such specific tax rate or tax treatment. *Totals may not foot due to rounding 30