Parker Hannifin Corporation Fiscal 2025 Second Quarter Earnings Presentation January 30, 2025 Exhibit 99.2
Forward-Looking Statements and Non-GAAP Financial Measures Forward-looking statements contained in this and other written and oral reports are made based on known events and circumstances at the time of release, and as such, are subject in the future to unforeseen uncertainties and risks. Often but not always, these statements may be identified from the use of forward-looking terminology such as “anticipates,” “believes,” “may,” “should,” “could,” “expects,” “targets,” “is likely,” “will,” or the negative of these terms and similar expressions, and may also include statements regarding future performance, orders, earnings projections, events or developments. Parker cautions readers not to place undue reliance on these statements. It is possible that the future performance may differ materially from expectations, including those based on past performance. Among other factors that may affect future performance are: changes in business relationships with and orders by or from major customers, suppliers or distributors, including delays or cancellations in shipments; disputes regarding contract terms, changes in contract costs and revenue estimates for new development programs; changes in product mix; ability to identify acceptable strategic acquisition targets; uncertainties surrounding timing, successful completion or integration of acquisitions and similar transactions; ability to successfully divest businesses planned for divestiture and realize the anticipated benefits of such divestitures; the determination and ability to successfully undertake business realignment activities and the expected costs, including cost savings, thereof; ability to implement successfully business and operating initiatives, including the timing, price and execution of share repurchases and other capital initiatives; availability, cost increases of or other limitations on our access to raw materials, component products and/or commodities if associated costs cannot be recovered in product pricing; ability to manage costs related to insurance and employee retirement and health care benefits; legal and regulatory developments and other government actions, including related to environmental protection, and associated compliance costs; supply chain and labor disruptions, including as a result of tariffs and labor shortages; threats associated with international conflicts and cybersecurity risks and risks associated with protecting our intellectual property; uncertainties surrounding the ultimate resolution of outstanding legal proceedings, including the outcome of any appeals; effects on market conditions, including sales and pricing, resulting from global reactions to U.S. trade policies; manufacturing activity, air travel trends, currency exchange rates, difficulties entering new markets and economic conditions such as inflation, deflation, interest rates and credit availability; inability to obtain, or meet conditions imposed for, required governmental and regulatory approvals; changes in the tax laws in the United States and foreign jurisdictions and judicial or regulatory interpretations thereof; and large scale disasters, such as floods, earthquakes, hurricanes, industrial accidents and pandemics. Readers should also consider forward-looking statements in light of risk factors discussed in Parker’s Annual Report on Form 10-K for the fiscal year ended June 30, 2024 and other periodic filings made with the SEC. This presentation contains references to non-GAAP financial information including adjusted net income, organic sales, adjusted earnings per share, adjusted segment operating margin for Parker and by segment, EBITDA, EBITDA margin, adjusted EBITDA, adjusted EBITDA margin, free cash flow, and free cash flow margin. As used in this presentation, EBITDA is defined as earnings before interest, taxes, depreciation and amortization. Adjusted EBITDA is defined as EBITDA before business realignment, integration costs to achieve, acquisition related expenses, and other one-time items. Free cash flow is defined as cash flow from operations less capital expenditures. Although adjusted net income, organic sales, adjusted earnings per share, adjusted segment operating margin for Parker and by segment, EBITDA, EBITDA margin, adjusted EBITDA, adjusted EBITDA margin, free cash flow, and free cash flow margin are not measures of performance calculated in accordance with GAAP, we believe that they are useful to an investor in evaluating the company performance for the periods presented. Detailed reconciliations of these non-GAAP financial measures to the comparable GAAP financial measures have been included in the appendix to this presentation. Please visit investors.parker.com for more information. 2
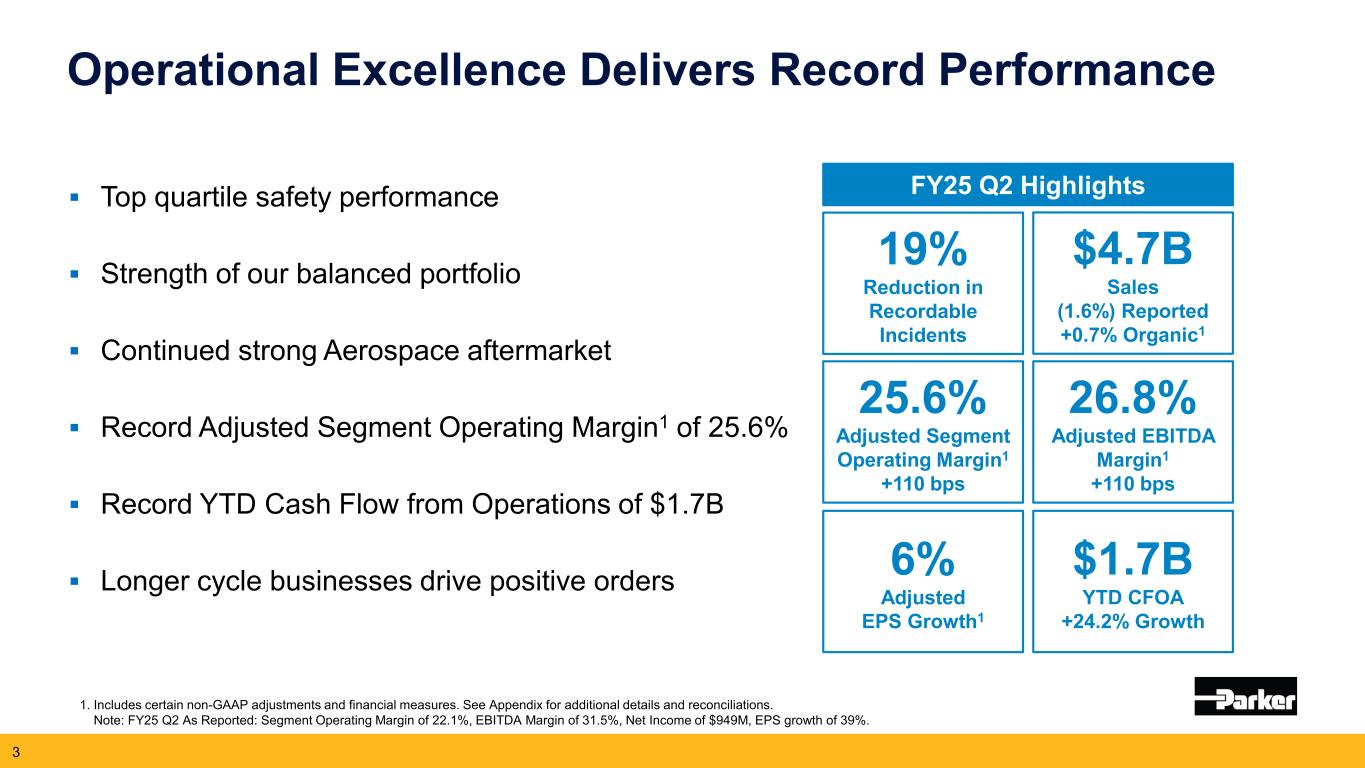
3 FY25 Q2 Highlights $4.7B Sales (1.6%) Reported +0.7% Organic1 25.6% Adjusted Segment Operating Margin1 +110 bps 26.8% Adjusted EBITDA Margin1 +110 bps $1.7B YTD CFOA +24.2% Growth Top quartile safety performance Strength of our balanced portfolio Continued strong Aerospace aftermarket Record Adjusted Segment Operating Margin1 of 25.6% Record YTD Cash Flow from Operations of $1.7B Longer cycle businesses drive positive orders Operational Excellence Delivers Record Performance 19% Reduction in Recordable Incidents 1. Includes certain non-GAAP adjustments and financial measures. See Appendix for additional details and reconciliations. Note: FY25 Q2 As Reported: Segment Operating Margin of 22.1%, EBITDA Margin of 31.5%, Net Income of $949M, EPS growth of 39%. 6% Adjusted EPS Growth1
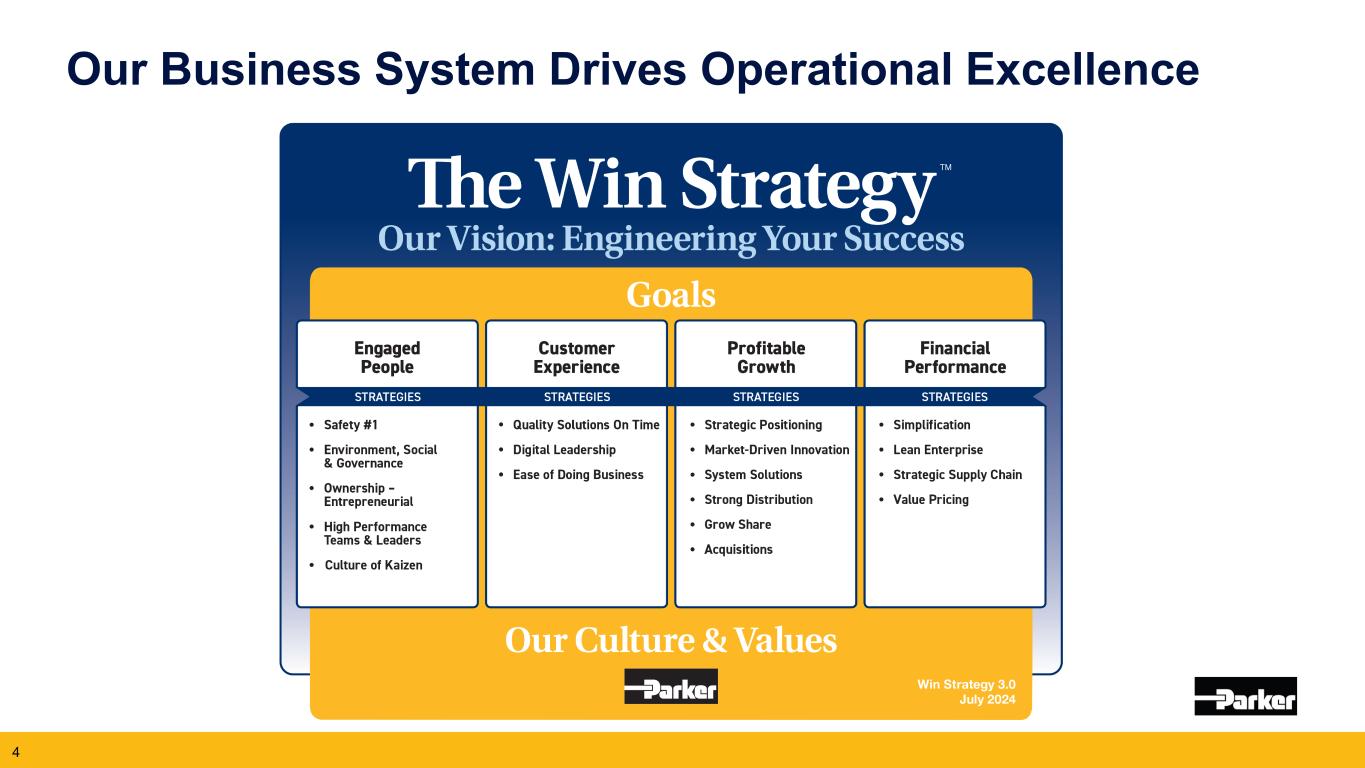
Our Business System Drives Operational Excellence 4
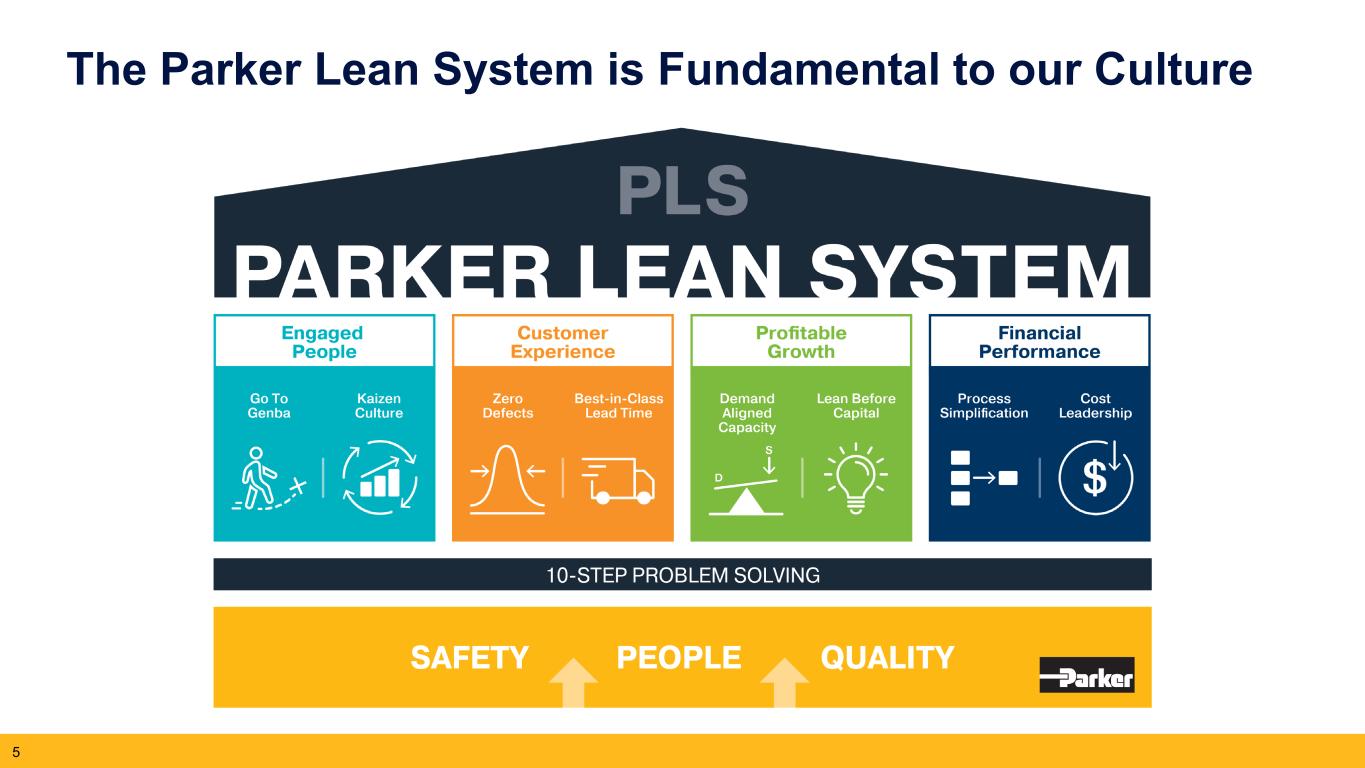
5 The Parker Lean System is Fundamental to our Culture
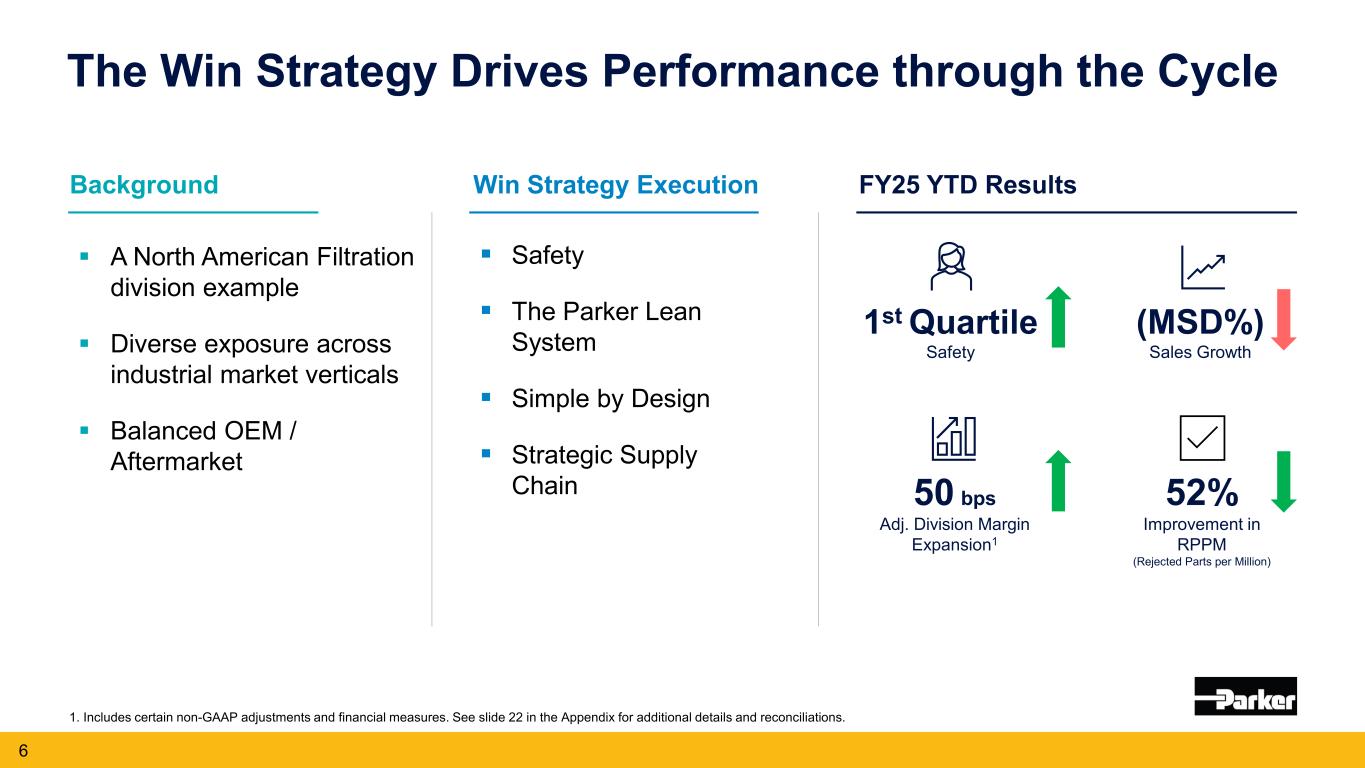
The Win Strategy Drives Performance through the Cycle FY25 YTD ResultsWin Strategy ExecutionBackground A North American Filtration division example Diverse exposure across industrial market verticals Balanced OEM / Aftermarket Safety The Parker Lean System Simple by Design Strategic Supply Chain 1st Quartile Safety 50 bps Adj. Division Margin Expansion1 52% Improvement in RPPM (Rejected Parts per Million) 6 (MSD%) Sales Growth 1. Includes certain non-GAAP adjustments and financial measures. See slide 22 in the Appendix for additional details and reconciliations.
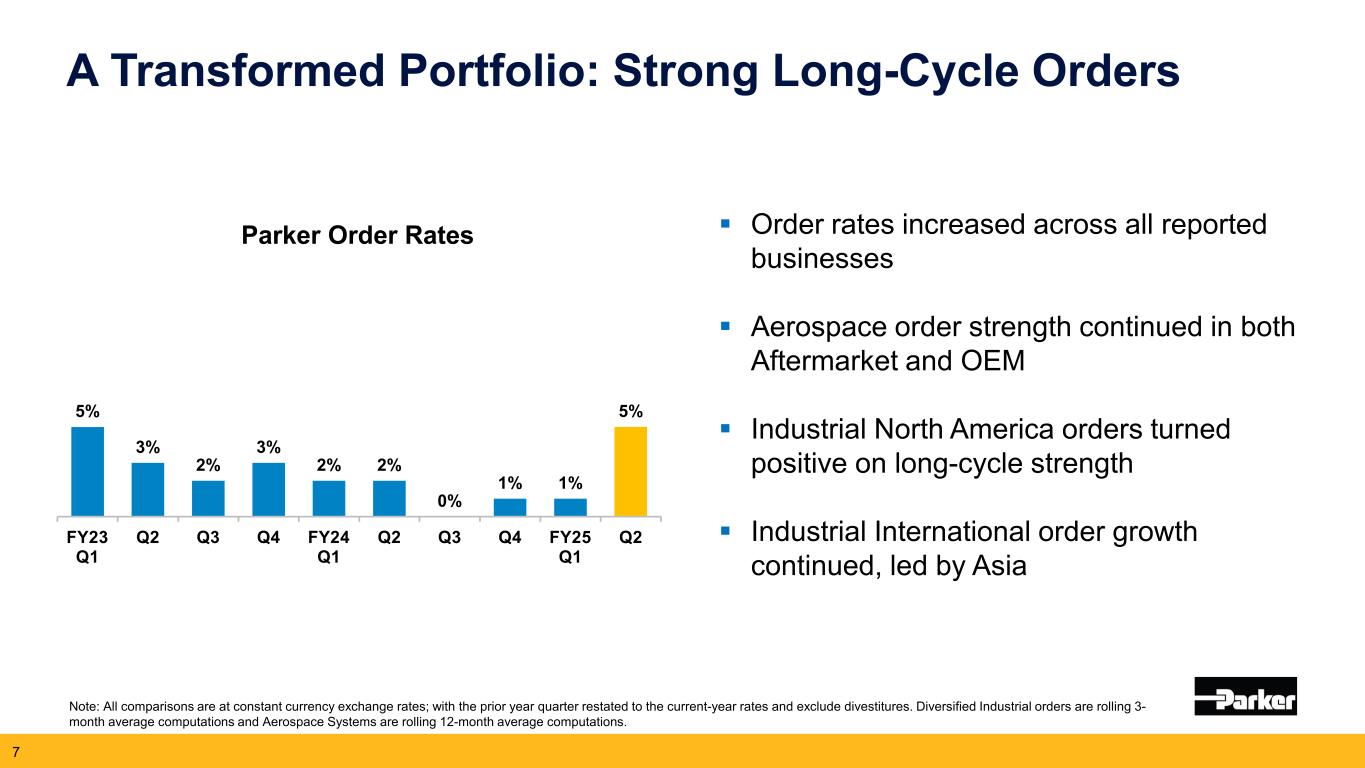
A Transformed Portfolio: Strong Long-Cycle Orders 5% 3% 2% 3% 2% 2% 0% 1% 1% 5% FY23 Q1 Q2 Q3 Q4 FY24 Q1 Q2 Q3 Q4 FY25 Q1 Q2 Order rates increased across all reported businesses Aerospace order strength continued in both Aftermarket and OEM Industrial North America orders turned positive on long-cycle strength Industrial International order growth continued, led by Asia Parker Order Rates Note: All comparisons are at constant currency exchange rates; with the prior year quarter restated to the current-year rates and exclude divestitures. Diversified Industrial orders are rolling 3- month average computations and Aerospace Systems are rolling 12-month average computations. 7
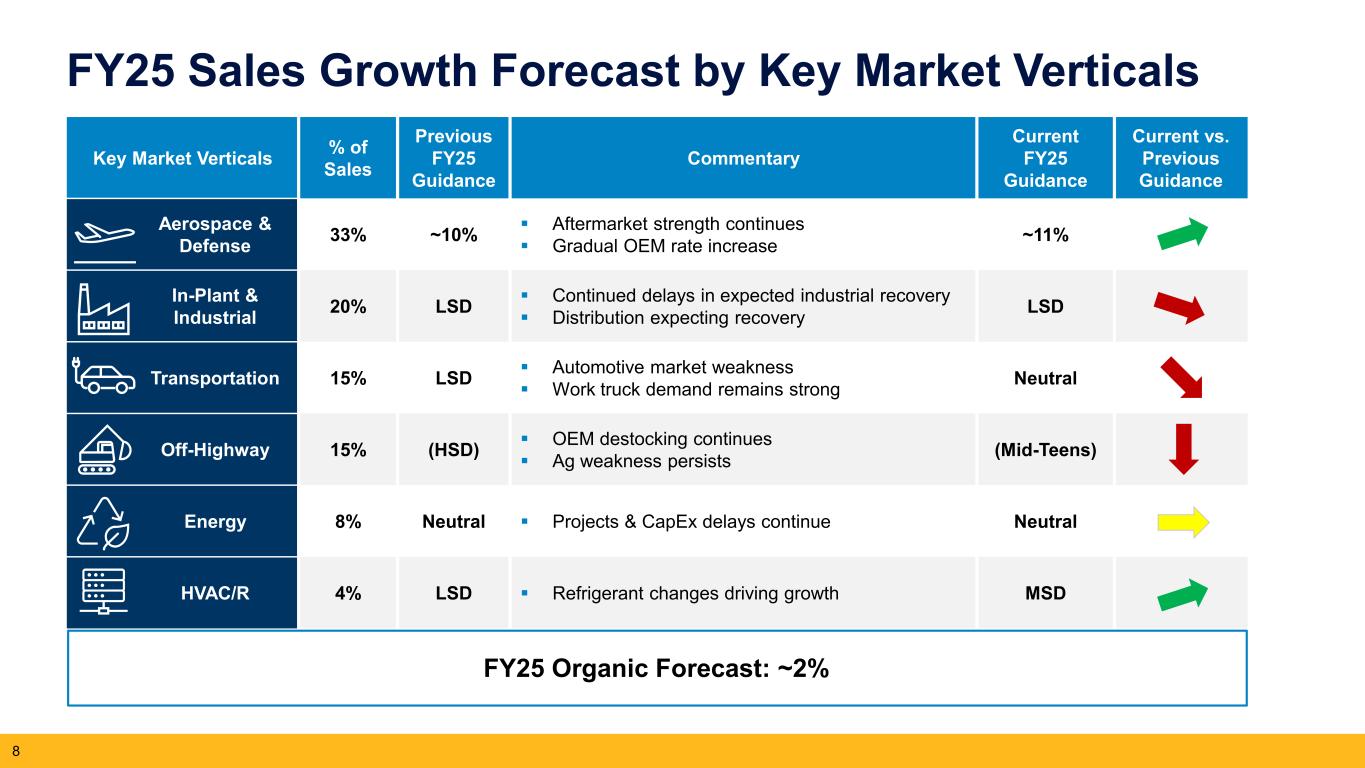
Key Market Verticals % of Sales Previous FY25 Guidance Commentary Current FY25 Guidance Current vs. Previous Guidance Aerospace & Defense 33% ~10% Aftermarket strength continues Gradual OEM rate increase ~11% In-Plant & Industrial 20% LSD Continued delays in expected industrial recovery Distribution expecting recovery LSD Transportation 15% LSD Automotive market weakness Work truck demand remains strong Neutral Off-Highway 15% (HSD) OEM destocking continues Ag weakness persists (Mid-Teens) Energy 8% Neutral Projects & CapEx delays continue Neutral HVAC/R 4% LSD Refrigerant changes driving growth MSD 8 FY25 Sales Growth Forecast by Key Market Verticals FY25 Organic Forecast: ~2%

Summary of Fiscal 2025 2nd Quarter Highlights
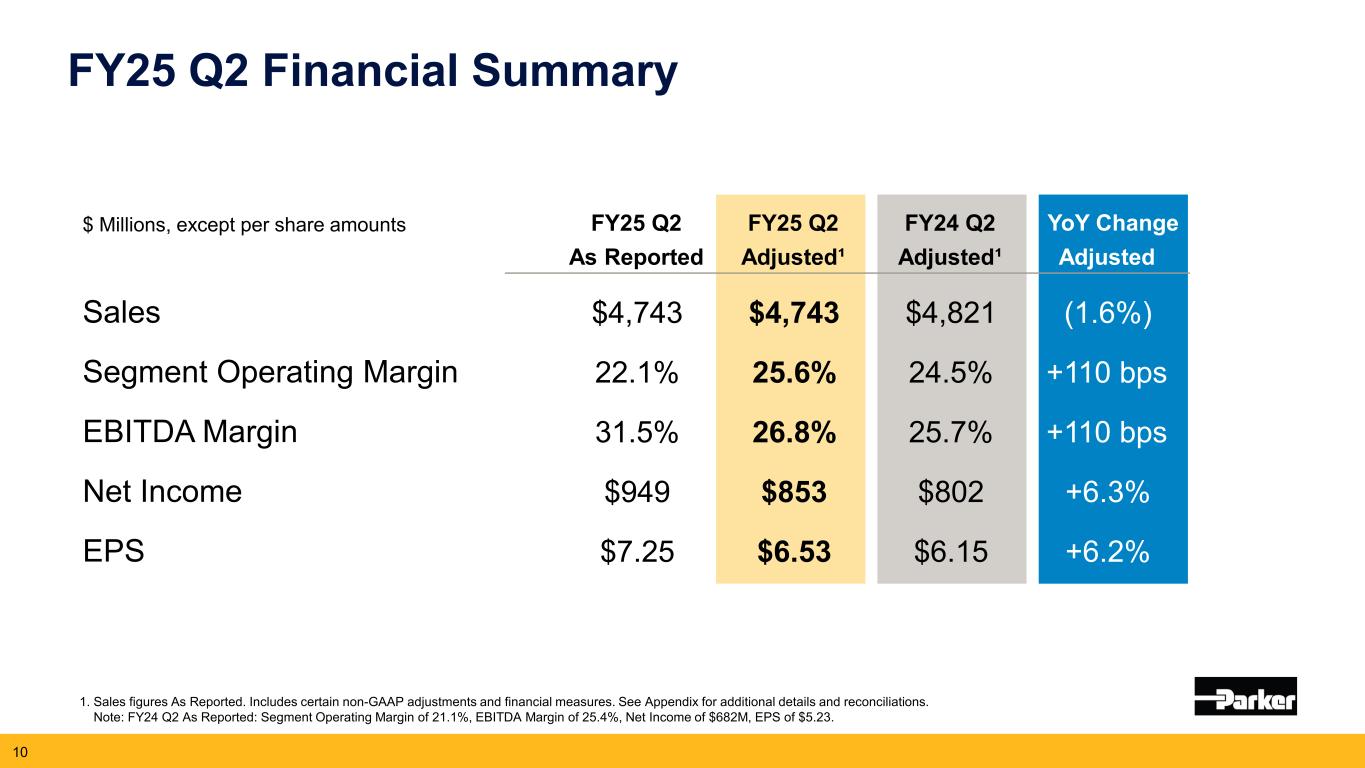
FY25 Q2 Financial Summary 1. Sales figures As Reported. Includes certain non-GAAP adjustments and financial measures. See Appendix for additional details and reconciliations. Note: FY24 Q2 As Reported: Segment Operating Margin of 21.1%, EBITDA Margin of 25.4%, Net Income of $682M, EPS of $5.23. 10 $ Millions, except per share amounts FY25 Q2 FY25 Q2 FY24 Q2 YoY Change As Reported Adjusted¹ Adjusted¹ Adjusted Sales $4,743 $4,743 $4,821 (1.6%) Segment Operating Margin 22.1% 25.6% 24.5% +110 bps EBITDA Margin 31.5% 26.8% 25.7% +110 bps Net Income $949 $853 $802 +6.3% EPS $7.25 $6.53 $6.15 +6.2%
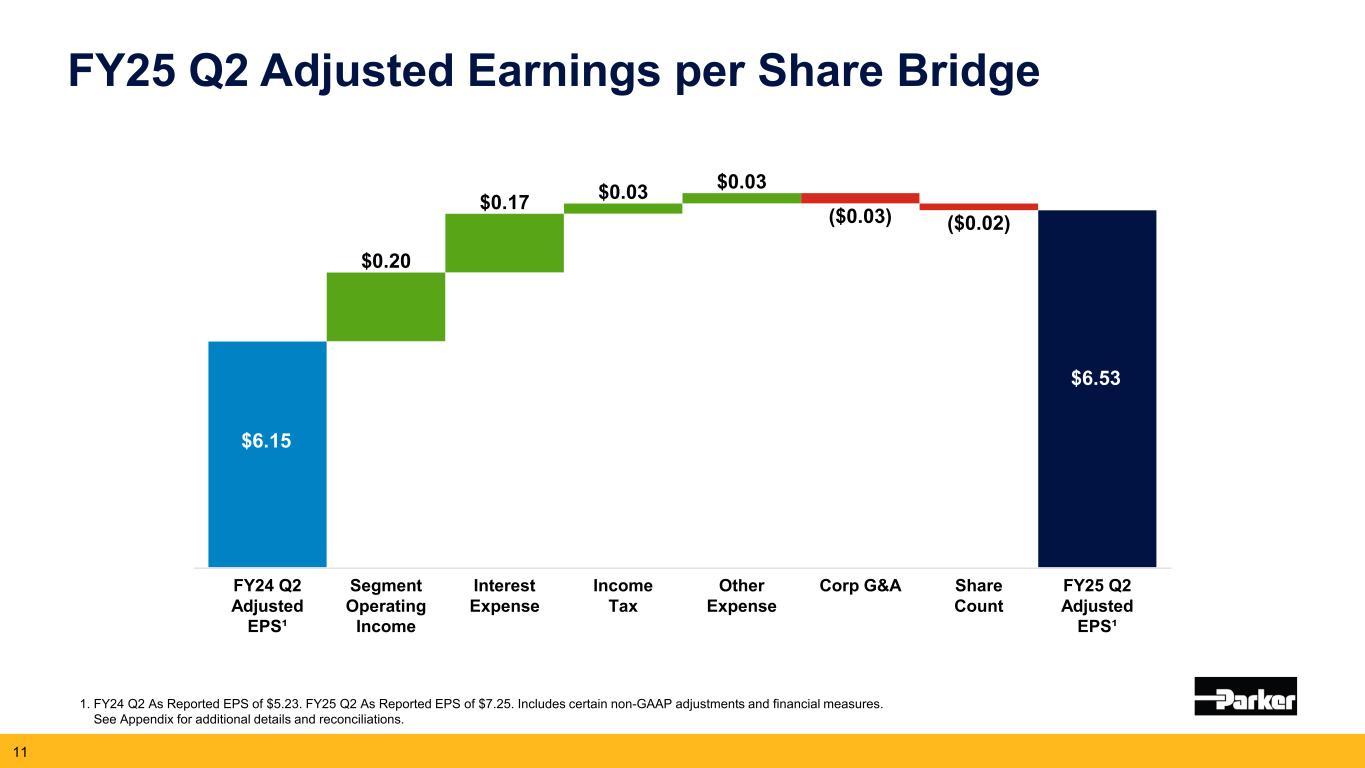
FY25 Q2 Adjusted Earnings per Share Bridge 1. FY24 Q2 As Reported EPS of $5.23. FY25 Q2 As Reported EPS of $7.25. Includes certain non-GAAP adjustments and financial measures. See Appendix for additional details and reconciliations. 11 $5.16 $6.13 $4.74 $5.96 $0.17 ($0.03) $0.20 $0.03 $0.03 ($0.02) FY24 Q2 Adjusted EPS¹ Segment Operating Income Interest Expense Income Tax Other Expense Corp G&A Share Count FY25 Q2 Adjusted EPS¹ $6.15 $6.53
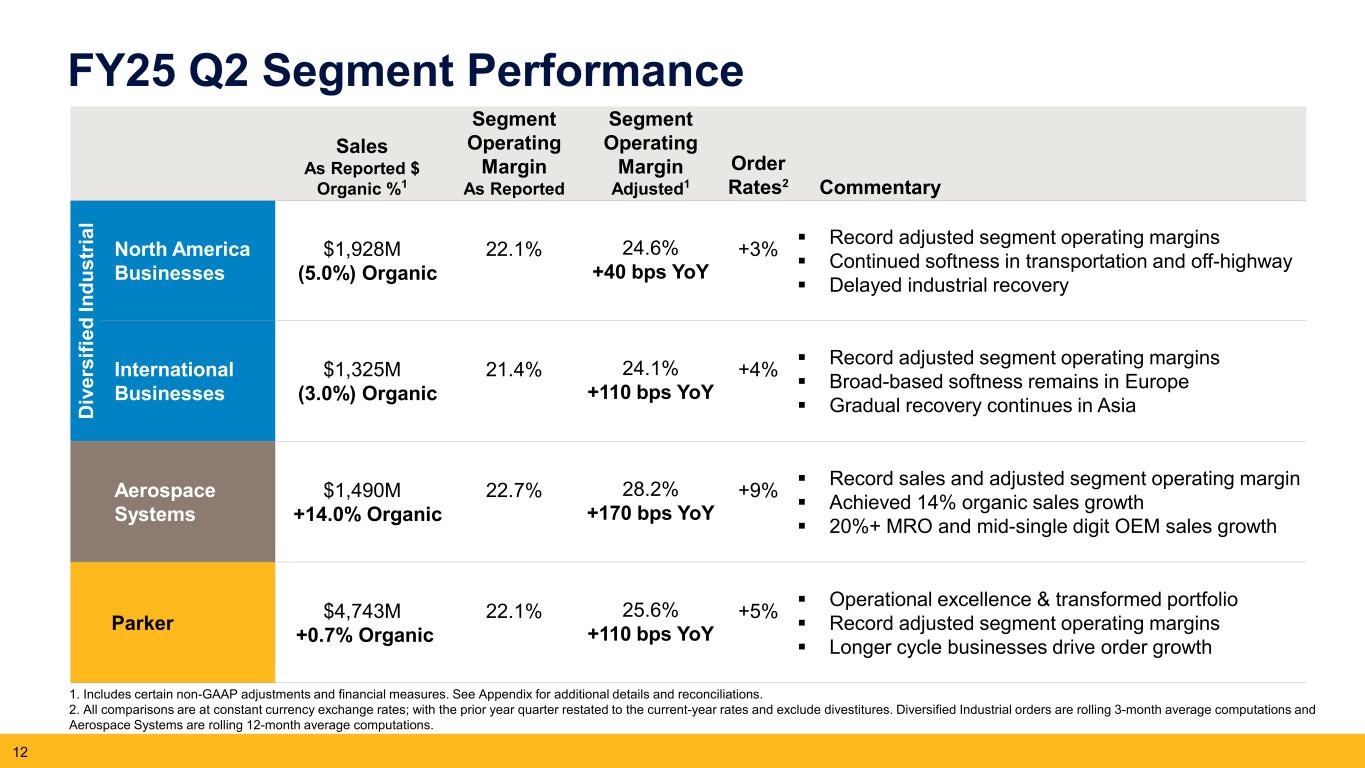
FY25 Q2 Segment Performance Sales As Reported $ Organic %1 Segment Operating Margin As Reported Segment Operating Margin Adjusted1 Order Rates2 Commentary D iv er si fie d In du st ria l North America Businesses $1,928M (5.0%) Organic 22.1% 24.6% +40 bps YoY +3% Record adjusted segment operating margins Continued softness in transportation and off-highway Delayed industrial recovery International Businesses $1,325M (3.0%) Organic 21.4% 24.1% +110 bps YoY +4% Record adjusted segment operating margins Broad-based softness remains in Europe Gradual recovery continues in Asia Aerospace Systems $1,490M +14.0% Organic 22.7% 28.2% +170 bps YoY +9% Record sales and adjusted segment operating margin Achieved 14% organic sales growth 20%+ MRO and mid-single digit OEM sales growth Parker $4,743M +0.7% Organic 22.1% 25.6% +110 bps YoY +5% Operational excellence & transformed portfolio Record adjusted segment operating margins Longer cycle businesses drive order growth 1. Includes certain non-GAAP adjustments and financial measures. See Appendix for additional details and reconciliations. 2. All comparisons are at constant currency exchange rates; with the prior year quarter restated to the current-year rates and exclude divestitures. Diversified Industrial orders are rolling 3-month average computations and Aerospace Systems are rolling 12-month average computations. 12
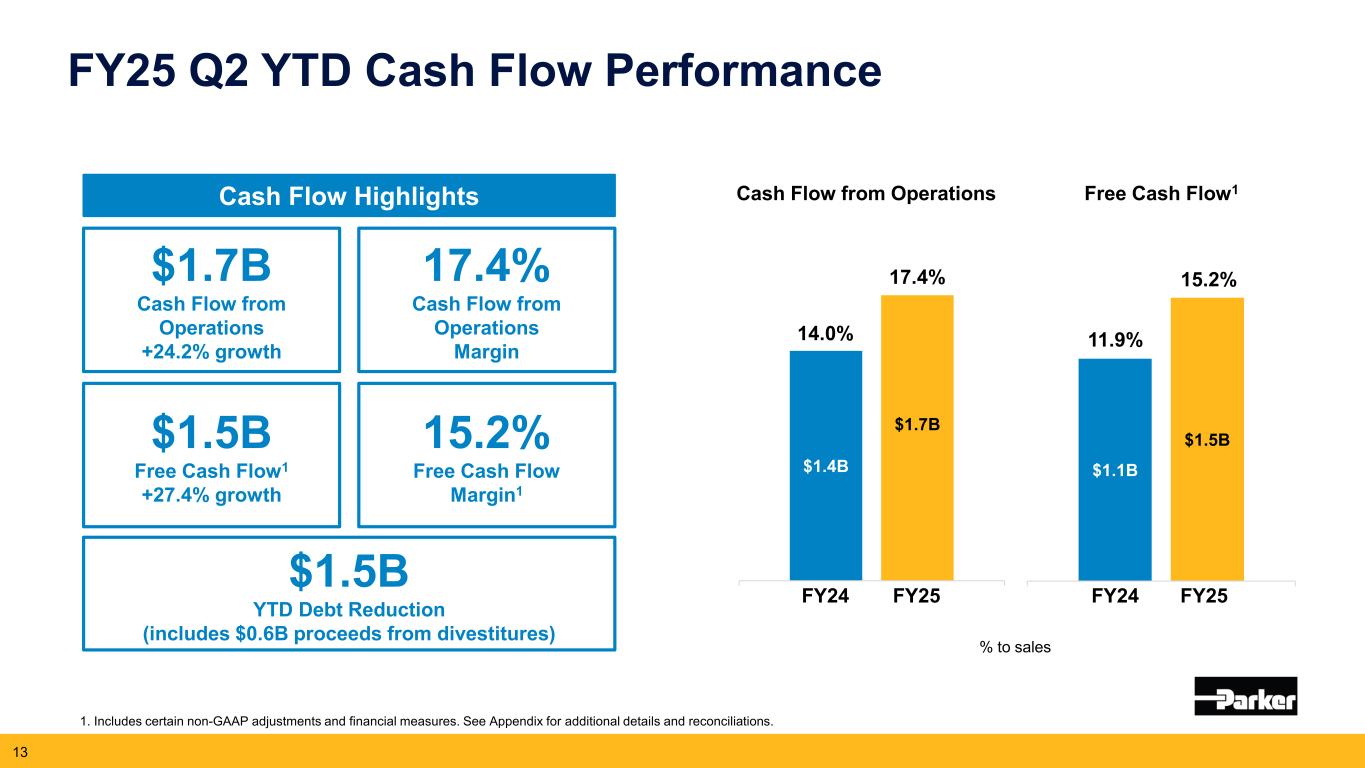
$1.1B $1.5B CFOA $1.4B $1.7B CFOA FY25 Q2 YTD Cash Flow Performance 1. Includes certain non-GAAP adjustments and financial measures. See Appendix for additional details and reconciliations. 13 Free Cash Flow1 11.9% 15.2% Cash Flow from Operations 14.0% 17.4% FY24 FY25 % to sales $1.7B Cash Flow from Operations +24.2% growth 17.4% Cash Flow from Operations Margin 15.2% Free Cash Flow Margin1 $1.5B Free Cash Flow1 +27.4% growth $1.5B YTD Debt Reduction (includes $0.6B proceeds from divestitures) Cash Flow Highlights FY25FY24
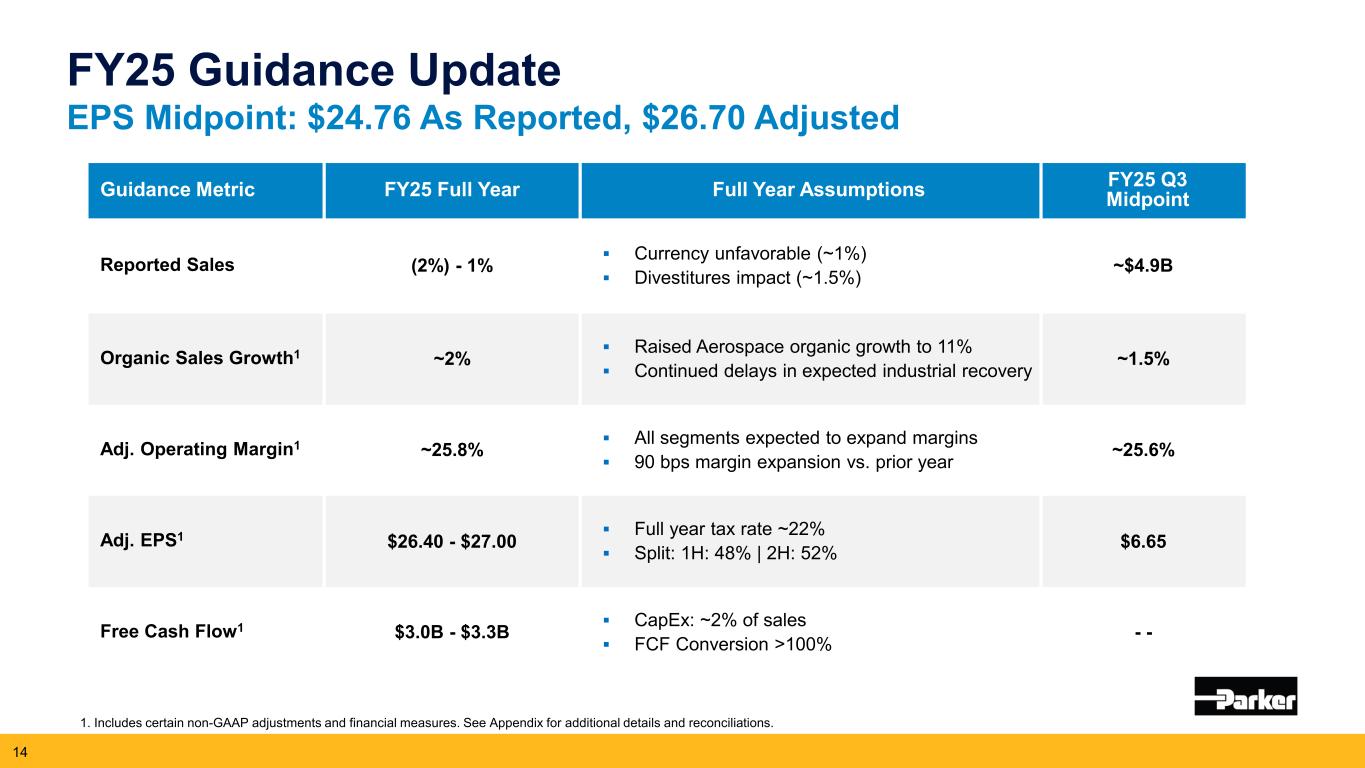
FY25 Guidance Update EPS Midpoint: $24.76 As Reported, $26.70 Adjusted 1. Includes certain non-GAAP adjustments and financial measures. See Appendix for additional details and reconciliations. 14 Guidance Metric FY25 Full Year Full Year Assumptions FY25 Q3 Midpoint Reported Sales (2%) - 1% Currency unfavorable (~1%) Divestitures impact (~1.5%) ~$4.9B Organic Sales Growth1 ~2% Raised Aerospace organic growth to 11% Continued delays in expected industrial recovery ~1.5% Adj. Operating Margin1 ~25.8% All segments expected to expand margins 90 bps margin expansion vs. prior year ~25.6% Adj. EPS1 $26.40 - $27.00 Full year tax rate ~22% Split: 1H: 48% | 2H: 52% $6.65 Free Cash Flow1 $3.0B - $3.3B CapEx: ~2% of sales FCF Conversion >100% - -
What Drives Parker Safety, Engagement, Ownership Living up to Our Purpose Top Quartile Performance Great Generators & Deployers of Cash 15

Upcoming Event Calendar FY25 Q3 Earnings Release May 1, 2025 FY25 Q4 Earnings Release August 7, 2025
Appendix FY25 Guidance Details Reconciliation of Organic Growth Adjusted Amounts Reconciliation – Consolidated Statement of Income Adjusted Amounts Reconciliation – Segment Operating Income Reconciliation of North American Filtration Division Margin to North American Filtration Division Adjusted Margin Reconciliation of EBITDA to Adjusted EBITDA Reconciliation of Free Cash Flow Margin Supplemental Sales Information – Global Technology Platforms Reconciliation of Q3 FY25 Guidance Reconciliation of FY25 Guidance 17
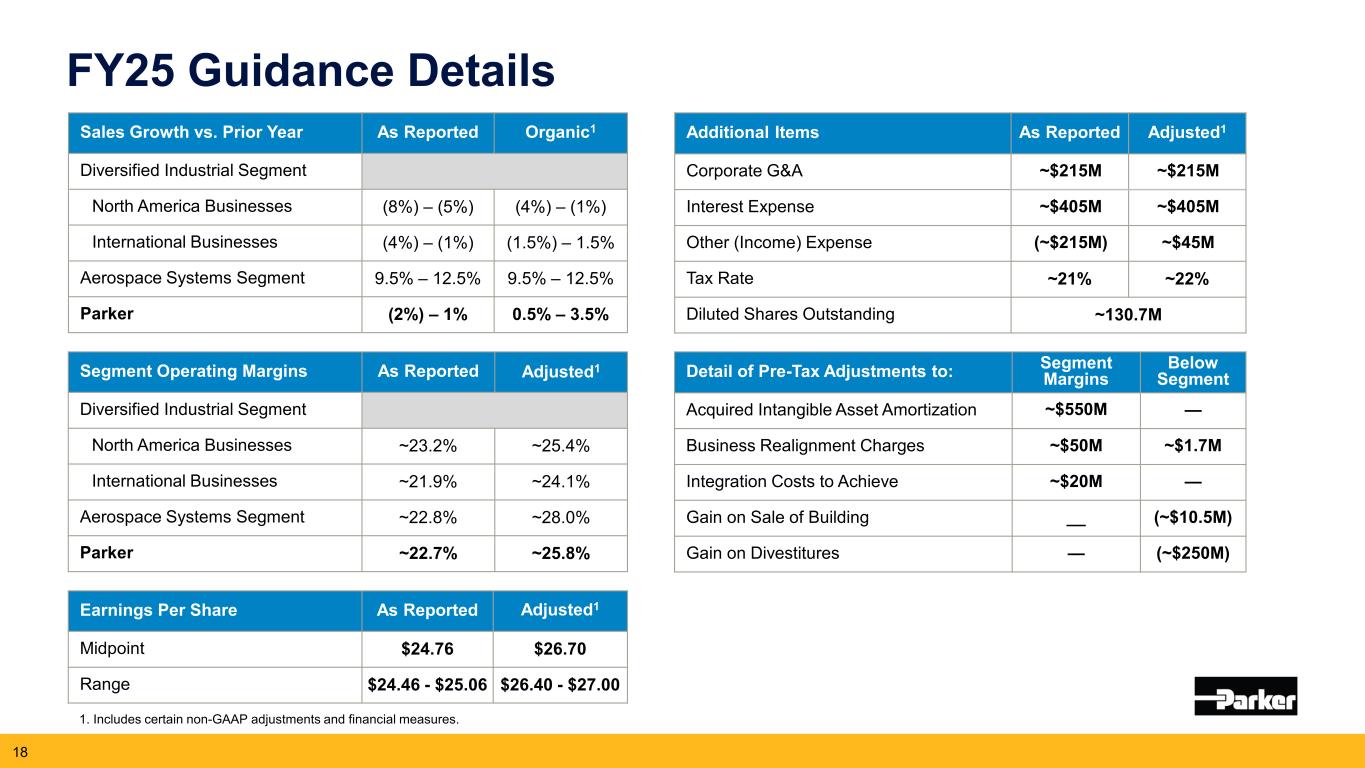
FY25 Guidance Details Sales Growth vs. Prior Year As Reported Organic1 Diversified Industrial Segment North America Businesses (8%) – (5%) (4%) – (1%) International Businesses (4%) – (1%) (1.5%) – 1.5% Aerospace Systems Segment 9.5% – 12.5% 9.5% – 12.5% Parker (2%) – 1% 0.5% – 3.5% Segment Operating Margins As Reported Adjusted1 Diversified Industrial Segment North America Businesses ~23.2% ~25.4% International Businesses ~21.9% ~24.1% Aerospace Systems Segment ~22.8% ~28.0% Parker ~22.7% ~25.8% Earnings Per Share As Reported Adjusted1 Midpoint $24.76 $26.70 Range $24.46 - $25.06 $26.40 - $27.00 1. Includes certain non-GAAP adjustments and financial measures. Detail of Pre-Tax Adjustments to: Segment Margins Below Segment Acquired Intangible Asset Amortization ~$550M — Business Realignment Charges ~$50M ~$1.7M Integration Costs to Achieve ~$20M — Gain on Sale of Building __ (~$10.5M) Gain on Divestitures — (~$250M) Additional Items As Reported Adjusted1 Corporate G&A ~$215M ~$215M Interest Expense ~$405M ~$405M Other (Income) Expense (~$215M) ~$45M Tax Rate ~21% ~22% Diluted Shares Outstanding ~130.7M 18
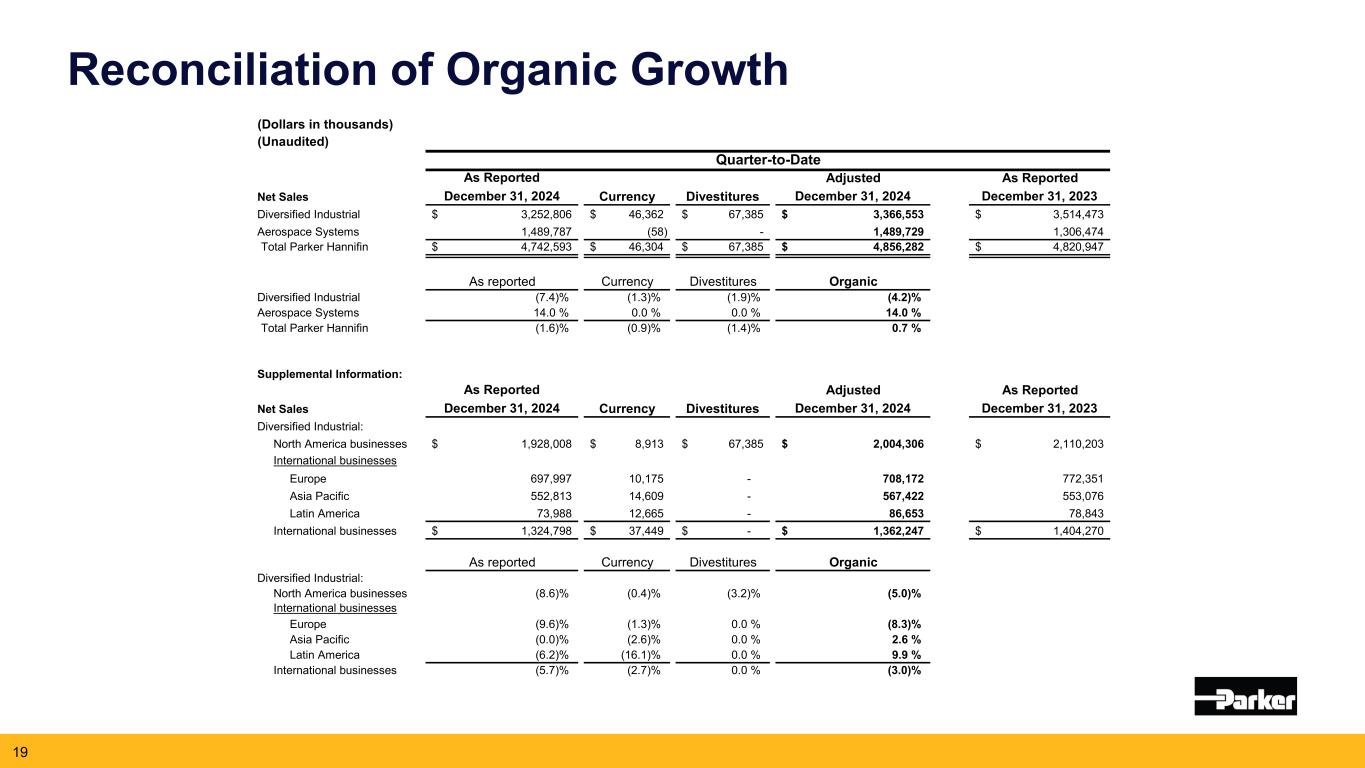
(Dollars in thousands) (Unaudited) Quarter-to-Date As Reported Adjusted As Reported Net Sales December 31, 2024 December 31, 2024 December 31, 2023 Diversified Industrial 3,252,806$ 46,362$ 67,385$ 3,366,553$ 3,514,473$ Aerospace Systems 1,489,787 (58) - 1,489,729 1,306,474 Total Parker Hannifin 4,742,593$ 46,304$ 67,385$ 4,856,282$ 4,820,947$ As reported Currency Divestitures Organic Diversified Industrial (7.4)% (1.3)% (1.9)% (4.2)% Aerospace Systems 14.0 % 0.0 % 0.0 % 14.0 % Total Parker Hannifin (1.6)% (0.9)% (1.4)% 0.7 % Supplemental Information: As Reported Adjusted As Reported Net Sales December 31, 2024 December 31, 2024 December 31, 2023 Diversified Industrial: North America businesses 1,928,008$ 8,913$ 67,385$ 2,004,306$ 2,110,203$ International businesses Europe 697,997 10,175 - 708,172 772,351 Asia Pacific 552,813 14,609 - 567,422 553,076 Latin America 73,988 12,665 - 86,653 78,843 International businesses 1,324,798$ 37,449$ -$ 1,362,247$ 1,404,270$ As reported Currency Divestitures Organic Diversified Industrial: North America businesses (8.6)% (0.4)% (3.2)% (5.0)% International businesses Europe (9.6)% (1.3)% 0.0 % (8.3)% Asia Pacific (0.0)% (2.6)% 0.0 % 2.6 % Latin America (6.2)% (16.1)% 0.0 % 9.9 % International businesses (5.7)% (2.7)% 0.0 % (3.0)% Currency Divestitures Currency Divestitures Reconciliation of Organic Growth 19
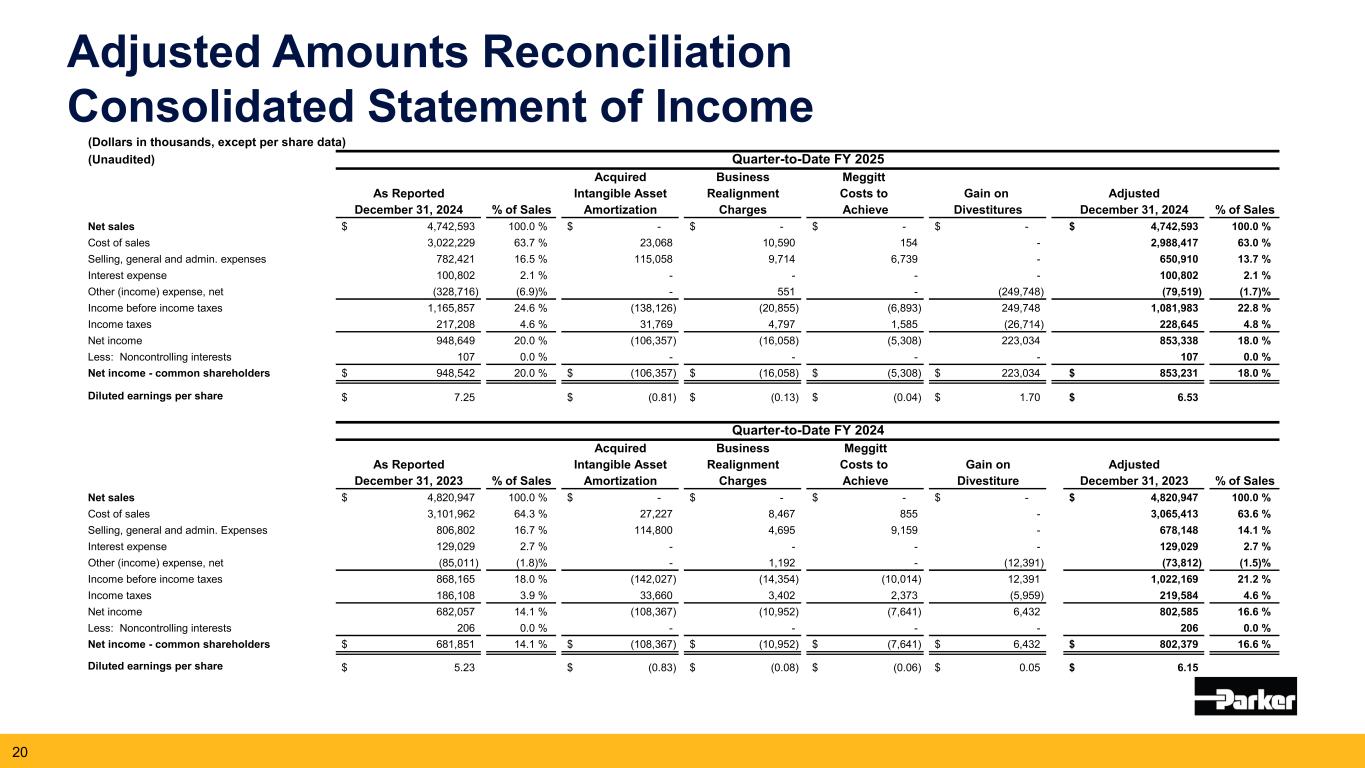
(Dollars in thousands, except per share data) (Unaudited) Quarter-to-Date FY 2025 Acquired Business Meggitt As Reported Intangible Asset Realignment Costs to Gain on Adjusted December 31, 2024 % of Sales Amortization Charges Achieve Divestitures December 31, 2024 % of Sales Net sales 4,742,593$ 100.0 % -$ -$ -$ -$ 4,742,593$ 100.0 % Cost of sales 3,022,229 63.7 % 23,068 10,590 154 - 2,988,417 63.0 % Selling, general and admin. expenses 782,421 16.5 % 115,058 9,714 6,739 - 650,910 13.7 % Interest expense 100,802 2.1 % - - - - 100,802 2.1 % Other (income) expense, net (328,716) (6.9)% - 551 - (249,748) (79,519) (1.7)% Income before income taxes 1,165,857 24.6 % (138,126) (20,855) (6,893) 249,748 1,081,983 22.8 % Income taxes 217,208 4.6 % 31,769 4,797 1,585 (26,714) 228,645 4.8 % Net income 948,649 20.0 % (106,357) (16,058) (5,308) 223,034 853,338 18.0 % Less: Noncontrolling interests 107 0.0 % - - - - 107 0.0 % Net income - common shareholders 948,542$ 20.0 % (106,357)$ (16,058)$ (5,308)$ 223,034$ 853,231$ 18.0 % Diluted earnings per share 7.25$ (0.81)$ (0.13)$ (0.04)$ 1.70$ 6.53$ Quarter-to-Date FY 2024 Acquired Business Meggitt As Reported Intangible Asset Realignment Costs to Gain on Adjusted December 31, 2023 % of Sales Amortization Charges Achieve Divestiture December 31, 2023 % of Sales Net sales 4,820,947$ 100.0 % -$ -$ -$ -$ 4,820,947$ 100.0 % Cost of sales 3,101,962 64.3 % 27,227 8,467 855 - 3,065,413 63.6 % Selling, general and admin. Expenses 806,802 16.7 % 114,800 4,695 9,159 - 678,148 14.1 % Interest expense 129,029 2.7 % - - - - 129,029 2.7 % Other (income) expense, net (85,011) (1.8)% - 1,192 - (12,391) (73,812) (1.5)% Income before income taxes 868,165 18.0 % (142,027) (14,354) (10,014) 12,391 1,022,169 21.2 % Income taxes 186,108 3.9 % 33,660 3,402 2,373 (5,959) 219,584 4.6 % Net income 682,057 14.1 % (108,367) (10,952) (7,641) 6,432 802,585 16.6 % Less: Noncontrolling interests 206 0.0 % - - - - 206 0.0 % Net income - common shareholders 681,851$ 14.1 % (108,367)$ (10,952)$ (7,641)$ 6,432$ 802,379$ 16.6 % Diluted earnings per share 5.23$ (0.83)$ (0.08)$ (0.06)$ 0.05$ 6.15$ Adjusted Amounts Reconciliation Consolidated Statement of Income 20
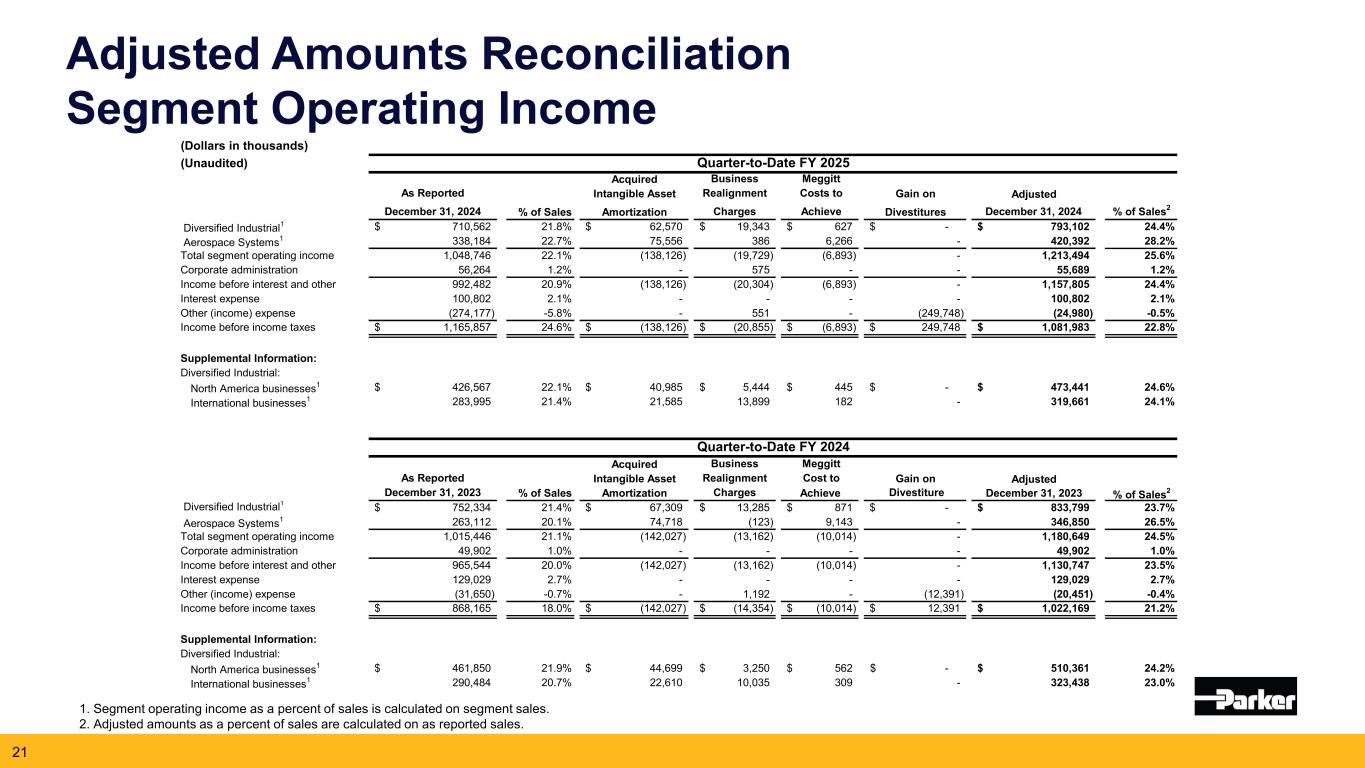
(Dollars in thousands) (Unaudited) Quarter-to-Date FY 2025 Acquired Business Meggitt As Reported Intangible Asset Realignment Costs to Gain on Adjusted December 31, 2024 % of Sales Amortization Charges Achieve Divestitures December 31, 2024 % of Sales2 Diversified Industrial1 710,562$ 21.8% 62,570$ 19,343$ 627$ -$ 793,102$ 24.4% Aerospace Systems1 338,184 22.7% 75,556 386 6,266 - 420,392 28.2% Total segment operating income 1,048,746 22.1% (138,126) (19,729) (6,893) - 1,213,494 25.6% Corporate administration 56,264 1.2% - 575 - - 55,689 1.2% Income before interest and other 992,482 20.9% (138,126) (20,304) (6,893) - 1,157,805 24.4% Interest expense 100,802 2.1% - - - - 100,802 2.1% Other (income) expense (274,177) -5.8% - 551 - (249,748) (24,980) -0.5% Income before income taxes 1,165,857$ 24.6% (138,126)$ (20,855)$ (6,893)$ 249,748$ 1,081,983$ 22.8% Supplemental Information: Diversified Industrial: North America businesses1 426,567$ 22.1% 40,985$ 5,444$ 445$ -$ 473,441$ 24.6% International businesses1 283,995 21.4% 21,585 13,899 182 - 319,661 24.1% Quarter-to-Date FY 2024 Acquired Business Meggitt As Reported Intangible Asset Realignment Cost to Gain on Adjusted December 31, 2023 % of Sales Amortization Charges Achieve Divestiture December 31, 2023 % of Sales2 Diversified Industrial1 752,334$ 21.4% 67,309$ 13,285$ 871$ -$ 833,799$ 23.7% Aerospace Systems1 263,112 20.1% 74,718 (123) 9,143 - 346,850 26.5% Total segment operating income 1,015,446 21.1% (142,027) (13,162) (10,014) - 1,180,649 24.5% Corporate administration 49,902 1.0% - - - - 49,902 1.0% Income before interest and other 965,544 20.0% (142,027) (13,162) (10,014) - 1,130,747 23.5% Interest expense 129,029 2.7% - - - - 129,029 2.7% Other (income) expense (31,650) -0.7% - 1,192 - (12,391) (20,451) -0.4% Income before income taxes 868,165$ 18.0% (142,027)$ (14,354)$ (10,014)$ 12,391$ 1,022,169$ 21.2% Supplemental Information: Diversified Industrial: North America businesses1 461,850$ 21.9% 44,699$ 3,250$ 562$ -$ 510,361$ 24.2% International businesses1 290,484 20.7% 22,610 10,035 309 - 323,438 23.0% Adjusted Amounts Reconciliation Segment Operating Income 1. Segment operating income as a percent of sales is calculated on segment sales. 2. Adjusted amounts as a percent of sales are calculated on as reported sales. 21
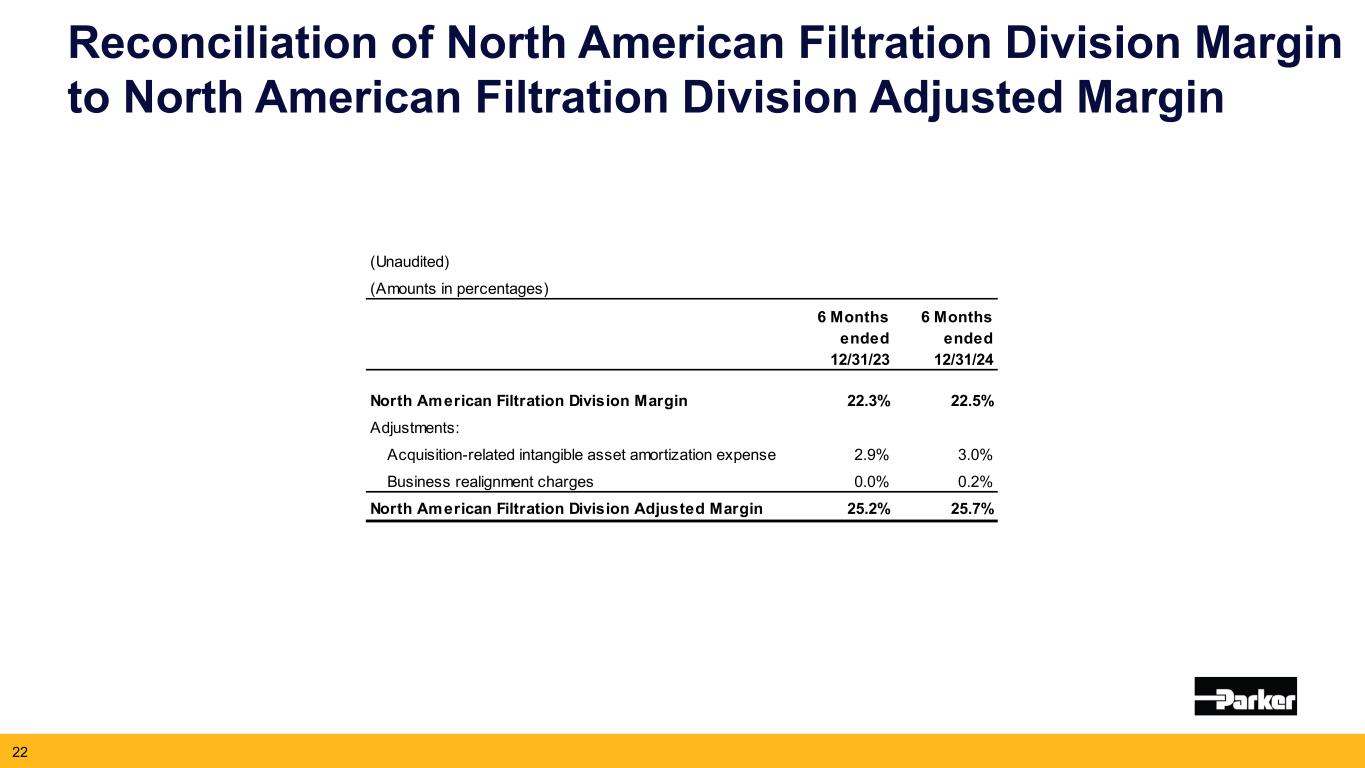
Reconciliation of North American Filtration Division Margin to North American Filtration Division Adjusted Margin 22 (Unaudited) (Amounts in percentages) 6 Months ended 12/31/23 6 Months ended 12/31/24 North American Filtration Division Margin 22.3% 22.5% Adjustments: Acquisition-related intangible asset amortization expense 2.9% 3.0% Business realignment charges 0.0% 0.2% North American Filtration Division Adjusted Margin 25.2% 25.7%
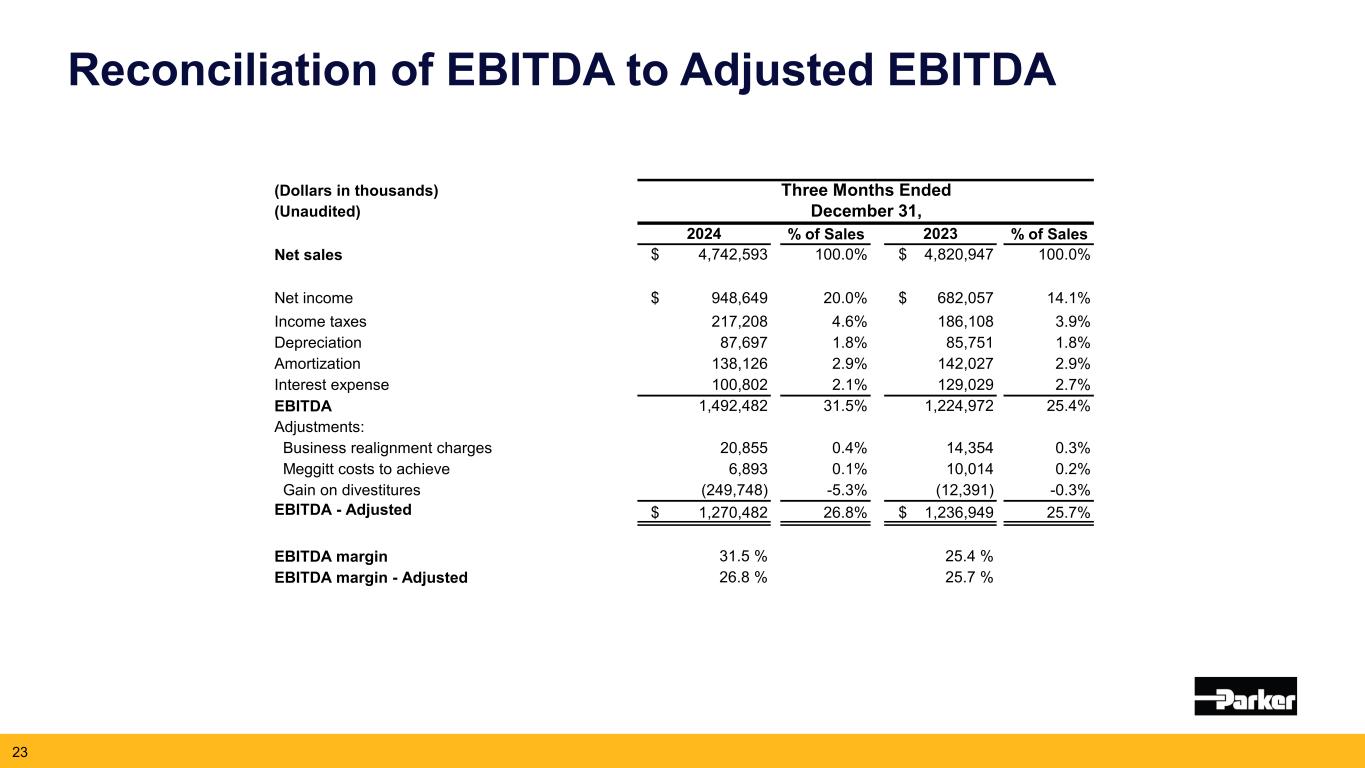
Reconciliation of EBITDA to Adjusted EBITDA (Dollars in thousands) Three Months Ended (Unaudited) December 31, 2024 % of Sales 2023 % of Sales Net sales $ 4,742,593 100.0% $ 4,820,947 100.0% Net income $ 948,649 20.0% $ 682,057 14.1% Income taxes 217,208 4.6% 186,108 3.9% Depreciation 87,697 1.8% 85,751 1.8% Amortization 138,126 2.9% 142,027 2.9% Interest expense 100,802 2.1% 129,029 2.7% EBITDA 1,492,482 31.5% 1,224,972 25.4% Adjustments: Business realignment charges 20,855 0.4% 14,354 0.3% Meggitt costs to achieve 6,893 0.1% 10,014 0.2% Gain on divestitures (249,748) -5.3% (12,391) -0.3% EBITDA - Adjusted $ 1,270,482 26.8% $ 1,236,949 25.7% EBITDA margin 31.5 % 25.4 % EBITDA margin - Adjusted 26.8 % 25.7 % 23
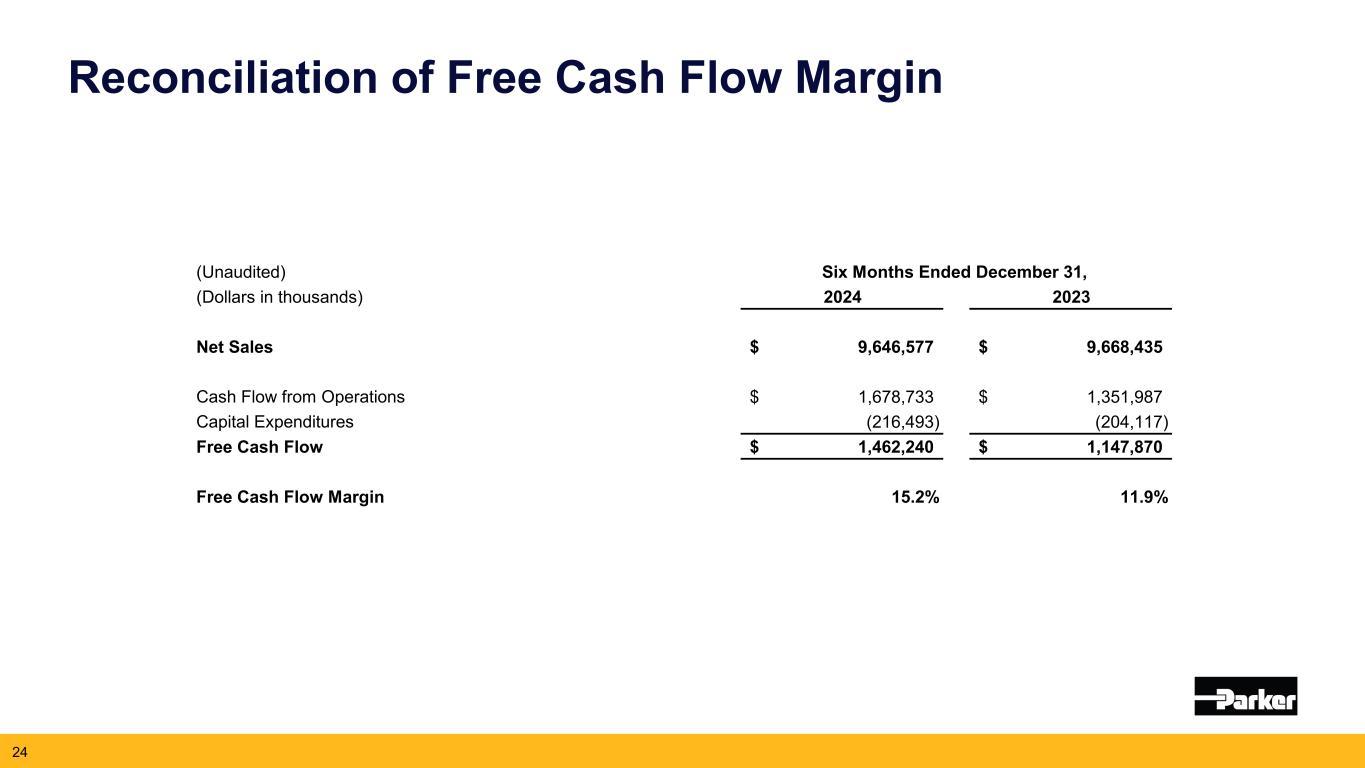
Reconciliation of Free Cash Flow Margin (Unaudited) (Dollars in thousands) 2024 2023 Net Sales 9,646,577$ 9,668,435$ Cash Flow from Operations 1,678,733$ 1,351,987$ Capital Expenditures (216,493) (204,117) Free Cash Flow 1,462,240$ 1,147,870$ Free Cash Flow Margin 15.2% 11.9% Six Months Ended December 31, 24
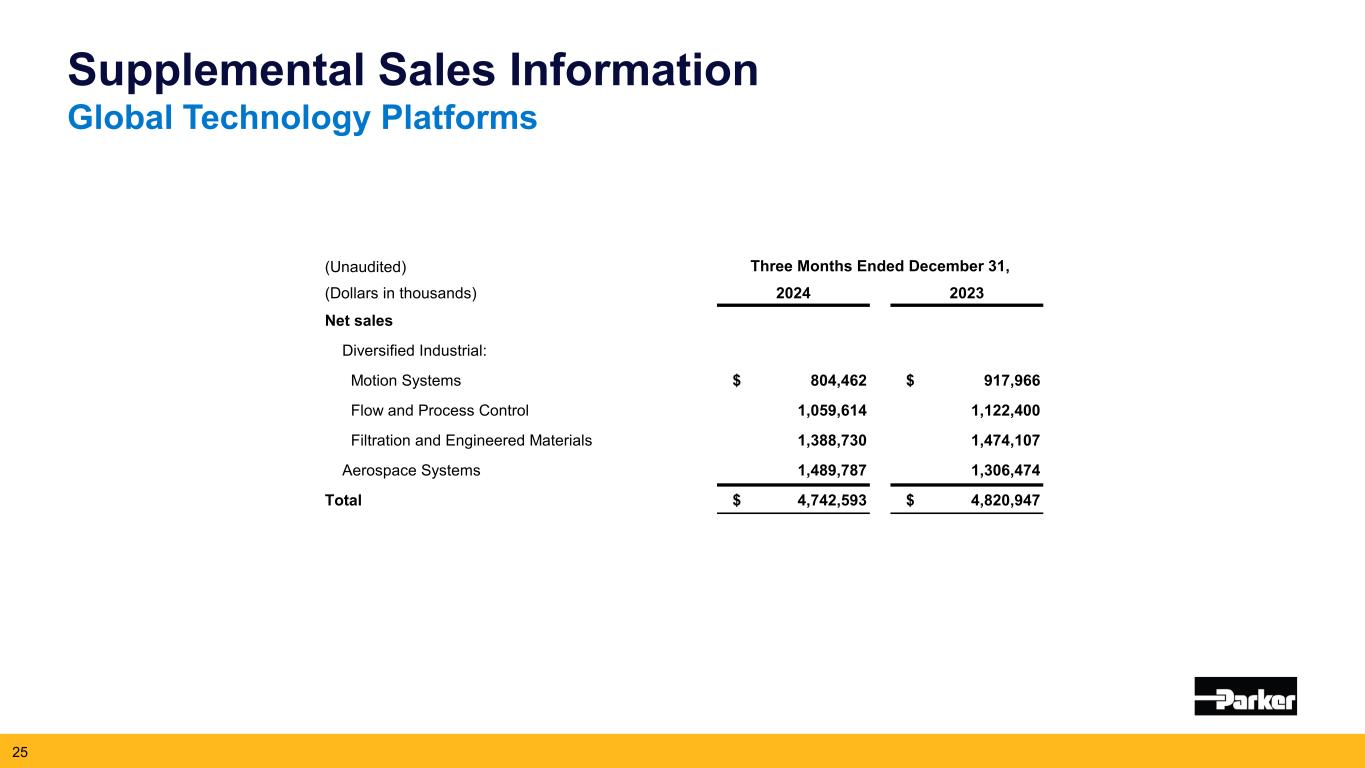
Supplemental Sales Information Global Technology Platforms 25 (Unaudited) (Dollars in thousands) 2024 2023 Net sales Diversified Industrial: Motion Systems $ 804,462 $ 917,966 Flow and Process Control 1,059,614 1,122,400 Filtration and Engineered Materials 1,388,730 1,474,107 Aerospace Systems 1,489,787 1,306,474 Total $ 4,742,593 $ 4,820,947 Three Months Ended December 31,
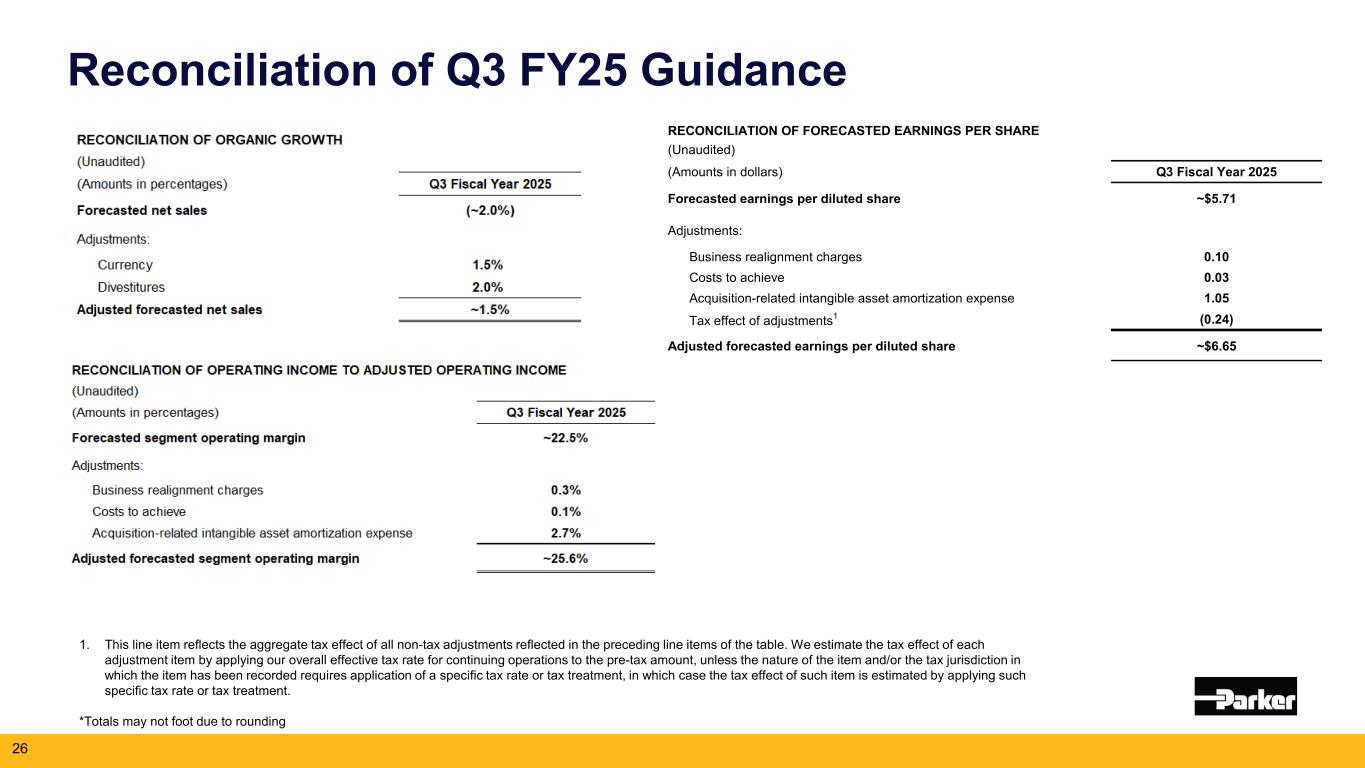
RECONCILIATION OF FORECASTED EARNINGS PER SHARE (Unaudited) (Amounts in dollars) Q3 Fiscal Year 2025 Forecasted earnings per diluted share ~$5.71 Adjustments: Business realignment charges 0.10 Costs to achieve 0.03 Acquisition-related intangible asset amortization expense 1.05 Tax effect of adjustments1 (0.24) Adjusted forecasted earnings per diluted share ~$6.65 Reconciliation of Q3 FY25 Guidance 1. This line item reflects the aggregate tax effect of all non-tax adjustments reflected in the preceding line items of the table. We estimate the tax effect of each adjustment item by applying our overall effective tax rate for continuing operations to the pre-tax amount, unless the nature of the item and/or the tax jurisdiction in which the item has been recorded requires application of a specific tax rate or tax treatment, in which case the tax effect of such item is estimated by applying such specific tax rate or tax treatment. *Totals may not foot due to rounding 26
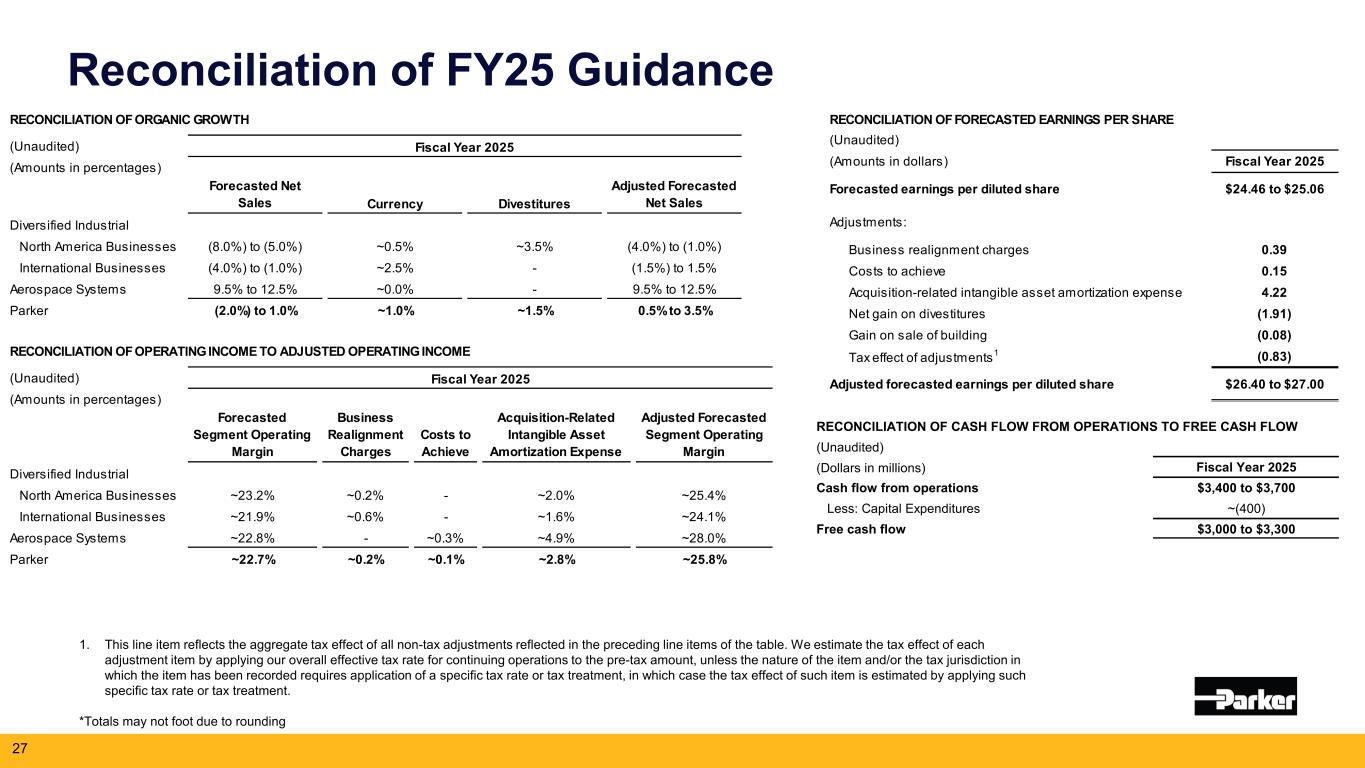
Reconciliation of FY25 Guidance 1. This line item reflects the aggregate tax effect of all non-tax adjustments reflected in the preceding line items of the table. We estimate the tax effect of each adjustment item by applying our overall effective tax rate for continuing operations to the pre-tax amount, unless the nature of the item and/or the tax jurisdiction in which the item has been recorded requires application of a specific tax rate or tax treatment, in which case the tax effect of such item is estimated by applying such specific tax rate or tax treatment. *Totals may not foot due to rounding 27 RECONCILIATION OF CASH FLOW FROM OPERATIONS TO FREE CASH FLOW (Unaudited) (Dollars in millions) Fiscal Year 2025 Cash flow from operations $3,400 to $3,700 Less: Capital Expenditures ~(400) Free cash flow $3,000 to $3,300 RECONCILIATION OF OPERATING INCOME TO ADJUSTED OPERATING INCOME (Unaudited) Fiscal Year 2025 (Amounts in percentages) Forecasted Segment Operating Margin Business Realignment Charges Costs to Achieve Acquisition-Related Intangible Asset Amortization Expense Adjusted Forecasted Segment Operating Margin Diversified Industrial North America Businesses ~23.2% ~0.2% - ~2.0% ~25.4% International Businesses ~21.9% ~0.6% - ~1.6% ~24.1% Aerospace Systems ~22.8% - ~0.3% ~4.9% ~28.0% Parker ~22.7% ~0.2% ~0.1% ~2.8% ~25.8% RECONCILIATION OF ORGANIC GROWTH (Unaudited) Fiscal Year 2025 (Amounts in percentages) Forecasted Net Sales Currency Divestitures Adjusted Forecasted Net Sales Diversified Industrial North America Businesses (8.0%) to (5.0%) ~0.5% ~3.5% (4.0%) to (1.0%) International Businesses (4.0%) to (1.0%) ~2.5% - (1.5%) to 1.5% Aerospace Systems 9.5% to 12.5% ~0.0% - 9.5% to 12.5% Parker (2.0%) to 1.0% ~1.0% ~1.5% 0.5% to 3.5% RECONCILIATION OF FORECASTED EARNINGS PER SHARE (Unaudited) (Amounts in dollars) Fiscal Year 2025 Forecasted earnings per diluted share $24.46 to $25.06 Adjustments: Business realignment charges 0.39 Costs to achieve 0.15 Acquisition-related intangible asset amortization expense 4.22 Net gain on divestitures (1.91) Gain on sale of building (0.08) Tax effect of adjustments1 (0.83) Adjusted forecasted earnings per diluted share $26.40 to $27.00