Parker’s Acquisition of LORD Corporation to Enhance Engineered Materials Business PH Listed
NYSE ENGINEERING YOUR SUCCESS. April 29, 2019
Forward-Looking Statements and Non-GAAP Financial
Measures 2 Forward-looking statements contained in this and other written and oral reports are made based on known events and circumstances at the time of release, and as such, are subject in the future to unforeseen uncertainties and
risks. These statements may be identified from the use of forward-looking terminology such as “anticipates,” “believes,” “may,” “should,” “could,” “potential,” “continues,” “plans,” “forecasts,” “estimates,” “projects,” “predicts,” “would,”
“intends,” “anticipates,” “expects,” “targets,” “is likely,” “will,” or the negative of these terms and similar expressions, and include all statements regarding future performance, earnings projections, events or developments. Parker
cautions readers not to place undue reliance on these statements.The risks and uncertainties in connection with such forward-looking statements related to the proposed transaction include, but are not limited to, the occurrence of any event,
change or other circumstances that could delay the closing of the proposed transaction; the possibility of non-consummation of the proposed transaction and termination of the merger agreement; the failure to satisfy any of the conditions to
the proposed transaction set forth in the merger agreement; the possibility that a governmental entity may prohibit the consummation of the proposed transaction or may delay or refuse to grant a necessary regulatory approval in connection
with the proposed transaction, or that in order for the parties to obtain any such regulatory approvals, conditions are imposed that adversely affect the anticipated benefits from the proposed transaction or cause the parties to abandon the
proposed transaction; adverse effects on Parker’s common stock because of the failure to complete the proposed transaction; Parker’s business experiencing disruptions due to transaction-related uncertainty or other factors making it more
difficult to maintain relationships with employees, business partners or governmental entities; the possibility that the expected synergies and value creation from the proposed transaction will not be realized or will not be realized within
the expected time period; the parties being unable to successfully implement integration strategies; and significant transaction costs related to the proposed transaction. Readers should consider these forward-looking statements in light of
risk factors discussed in Parker’s Annual Report on Form 10-K for the fiscal year ended June 30, 2018 filed on August 24, 2018 and other periodic filings made with the SEC. Parker makes these statements as of the date of this disclosure and
undertakes no obligation to update them unless otherwise required by law.This presentation contains references to adjusted net sales, EBITDA and adjusted EBITDA. Adjusted net sales is defined as net sales with those sales attributable to
portions of the business which are to be divested removed. EBITDA is defined as earnings before interest, taxes, depreciation and amortization. Adjusted EBITDA is defined as EBITDA before business realignment, CLARCOR costs to achieve, net
loss on sale and write-down of assets and non-recurring charges. Although adjusted net sales, EBITDA and adjusted EBITDA are not measures of performance calculated in accordance with GAAP, we believe that they are useful to an investor in
evaluating the transaction proposed in this presentation. Detailed reconciliations of these non-GAAP financial measures to the comparable GAAP financial measures have been included in the appendix to this presentation.Please visit
www.PHstock.com for more information
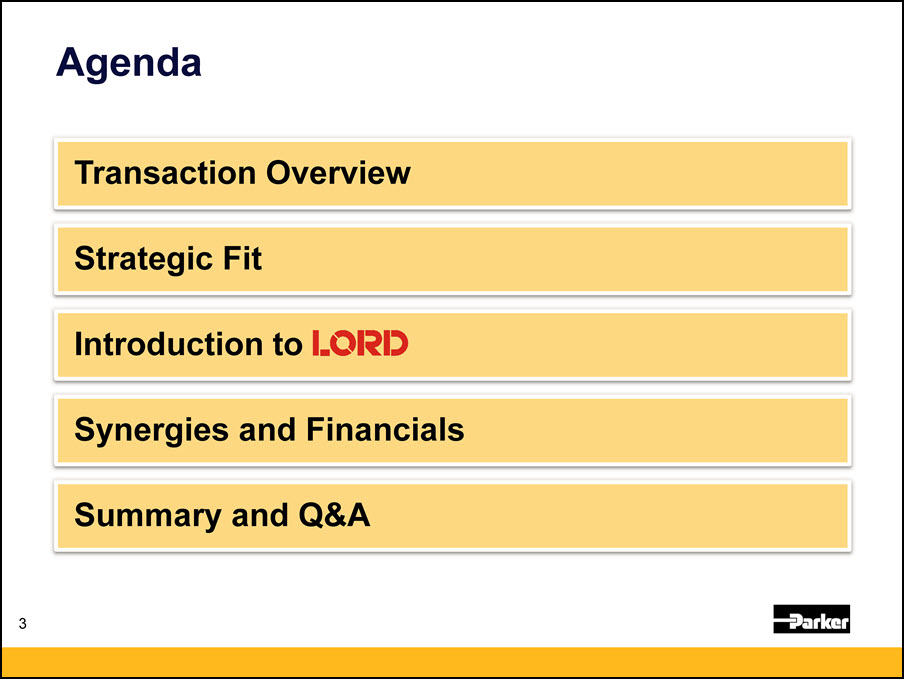
Agenda Transaction Overview Strategic Fit Introduction to Summary and Q&A Synergies and
Financials 3
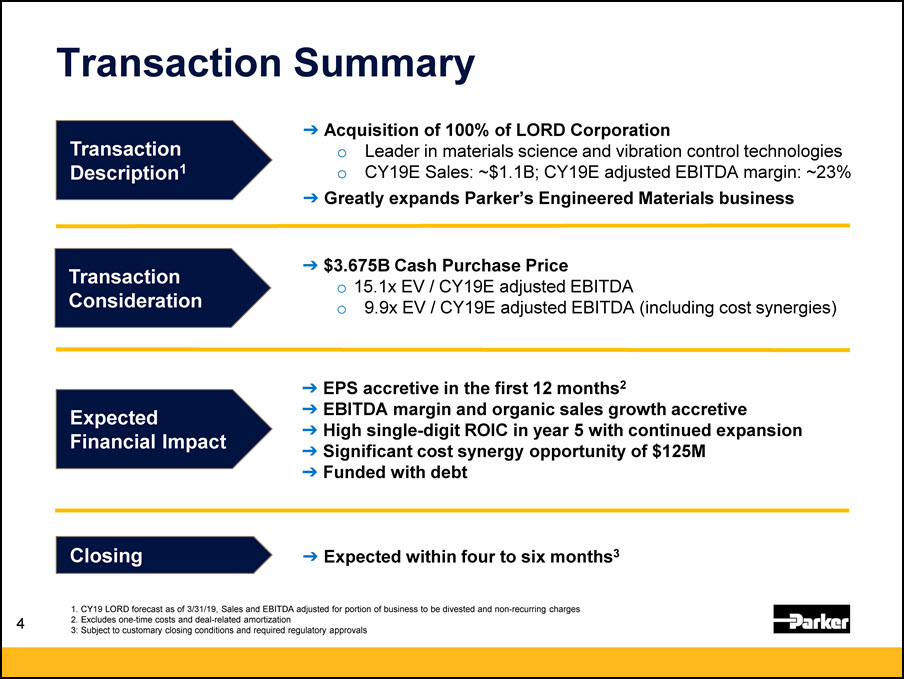
4 Transaction Summary Transaction Description1 Transaction Consideration ExpectedFinancial
Impact Closing 1. CY19 LORD forecast as of 3/31/19, Sales and EBITDA adjusted for portion of business to be divested and non-recurring charges2. Excludes one-time costs and deal-related amortization3: Subject to customary closing conditions
and required regulatory approvals Acquisition of 100% of LORD CorporationLeader in materials science and vibration control technologiesCY19E Sales: ~$1.1B; CY19E adjusted EBITDA margin: ~23%Greatly expands Parker’s Engineered Materials
business $3.675B Cash Purchase Price 15.1x EV / CY19E adjusted EBITDA9.9x EV / CY19E adjusted EBITDA (including cost synergies) EPS accretive in the first 12 months2EBITDA margin and organic sales growth accretive High single-digit ROIC in
year 5 with continued expansionSignificant cost synergy opportunity of $125MFunded with debt Expected within four to six months3
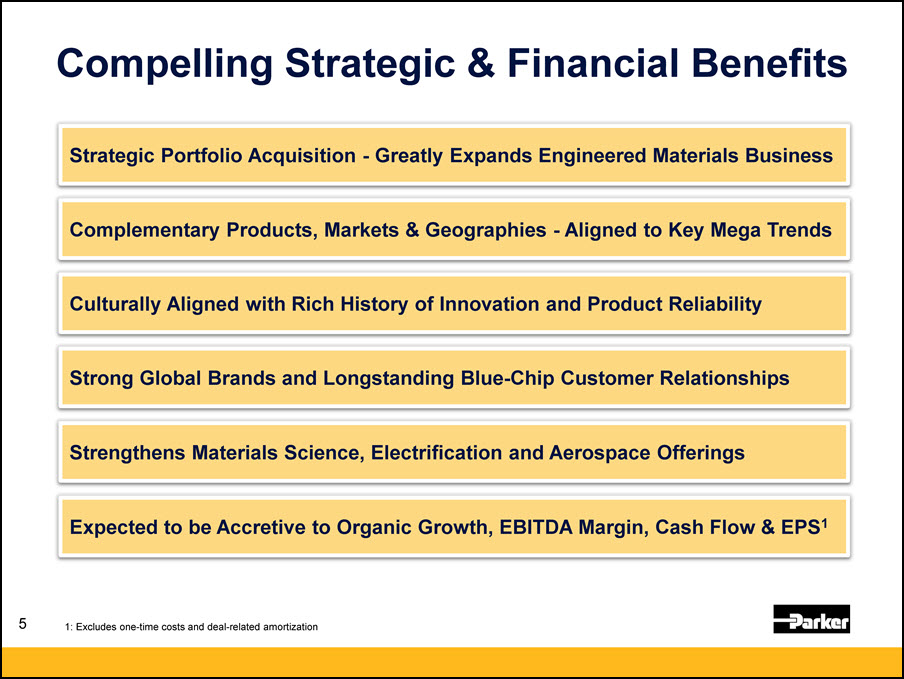
Strategic Portfolio Acquisition - Greatly Expands Engineered Materials Business Culturally Aligned with
Rich History of Innovation and Product Reliability Strong Global Brands and Longstanding Blue-Chip Customer Relationships Strengthens Materials Science, Electrification and Aerospace Offerings Compelling Strategic & Financial
Benefits Complementary Products, Markets & Geographies - Aligned to Key Mega Trends Expected to be Accretive to Organic Growth, EBITDA Margin, Cash Flow & EPS1 1: Excludes one-time costs and deal-related amortization 5
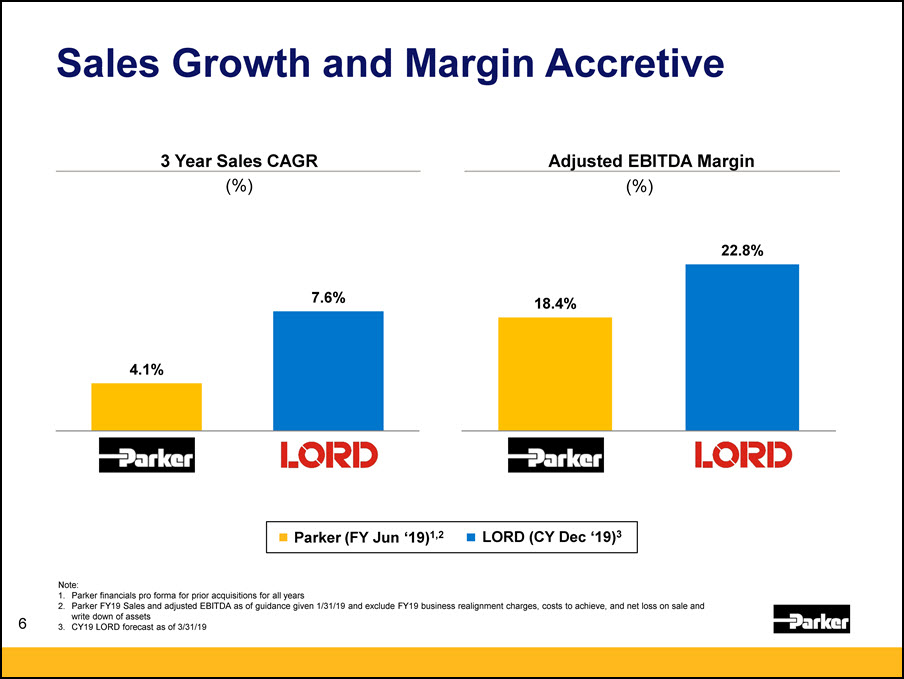
Sales Growth and Margin Accretive 6 Note: Parker financials pro forma for prior acquisitions for all
yearsParker FY19 Sales and adjusted EBITDA as of guidance given 1/31/19 and exclude FY19 business realignment charges, costs to achieve, and net loss on sale and write down of assetsCY19 LORD forecast as of 3/31/19 LORD (CY Dec
‘19)3 Parker (FY Jun ‘19)1,2 3 Year Sales CAGR (%) Adjusted EBITDA Margin (%)
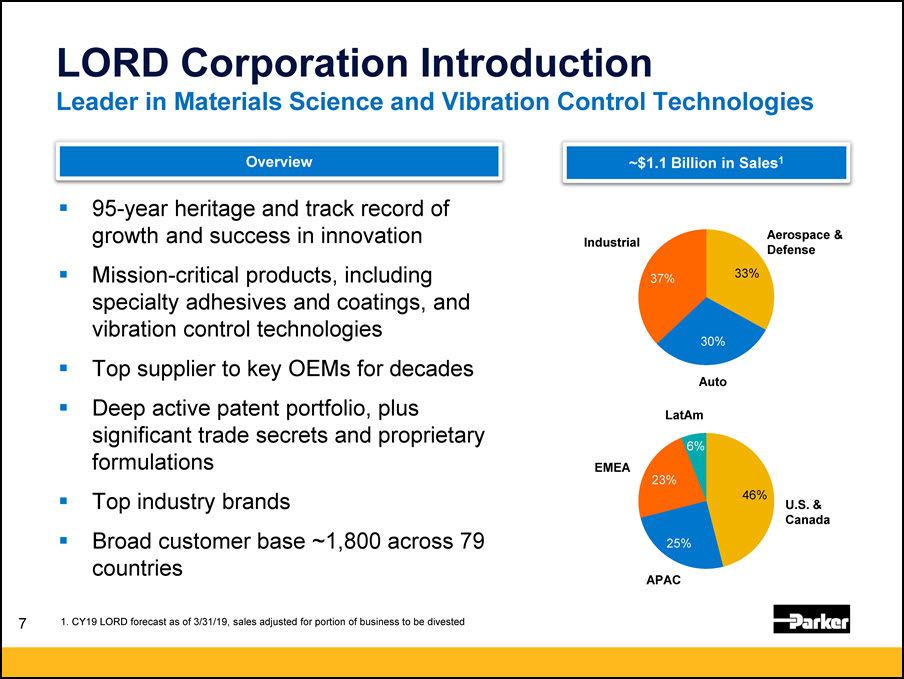
95-year heritage and track record of growth and success in innovationMission-critical products, including
specialty adhesives and coatings, and vibration control technologiesTop supplier to key OEMs for decadesDeep active patent portfolio, plus significant trade secrets and proprietary formulations Top industry brandsBroad customer base ~1,800
across 79 countries 7 Industrial Aerospace &Defense APAC EMEA LatAm U.S. &Canada Auto LORD Corporation IntroductionLeader in Materials Science and Vibration Control Technologies ~$1.1 Billion in Sales1 Overview 1. CY19 LORD
forecast as of 3/31/19, sales adjusted for portion of business to be divested
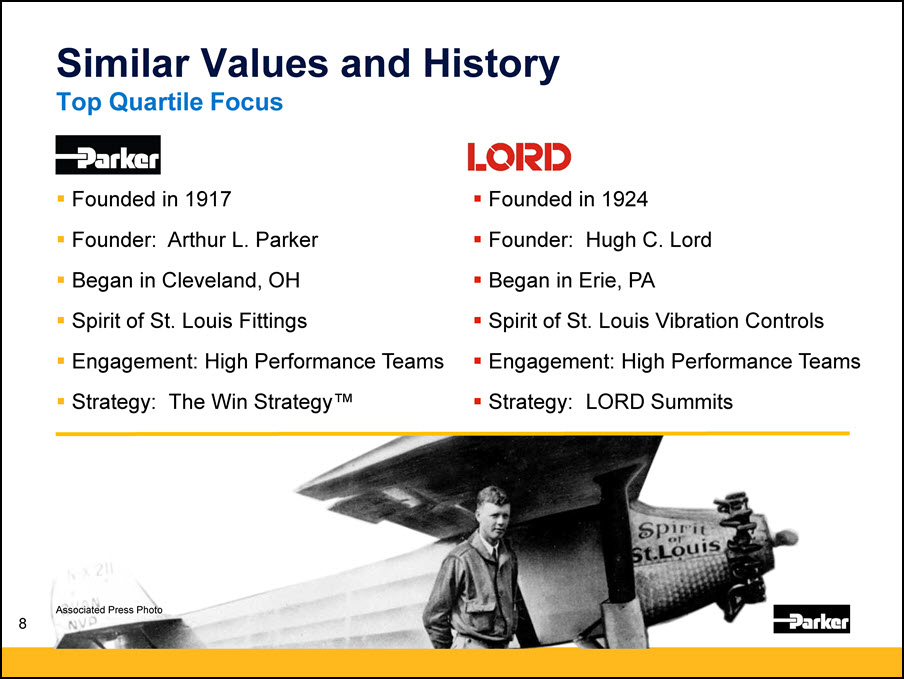
8 Similar Values and HistoryTop Quartile Focus Founded in 1917Founder: Arthur L. ParkerBegan in
Cleveland, OHSpirit of St. Louis FittingsEngagement: High Performance TeamsStrategy: The Win Strategy™ Founded in 1924Founder: Hugh C. LordBegan in Erie, PASpirit of St. Louis Vibration ControlsEngagement: High Performance TeamsStrategy: LORD
Summits Associated Press Photo
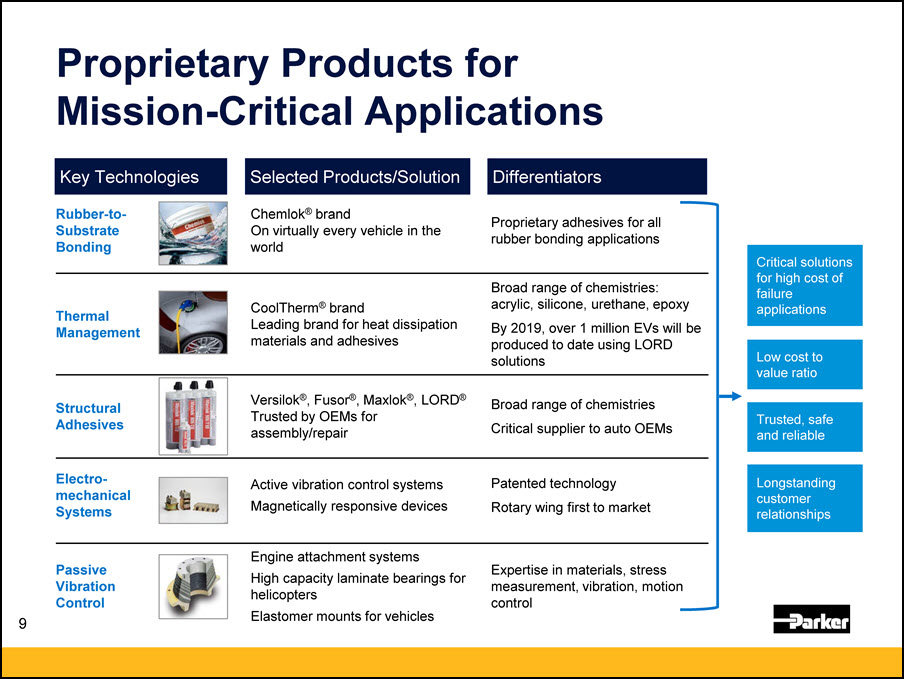
Proprietary Products for Mission-Critical Applications Selected
Products/Solution Differentiators Rubber-to-Substrate Bonding Chemlok® brandOn virtually every vehicle in the world Proprietary adhesives for all rubber bonding applications Thermal Management CoolTherm® brandLeading brand for heat
dissipation materials and adhesives Broad range of chemistries: acrylic, silicone, urethane, epoxyBy 2019, over 1 million EVs will be produced to date using LORD solutions Structural Adhesives Versilok®, Fusor®, Maxlok®, LORD® Trusted by
OEMs for assembly/repair Broad range of chemistriesCritical supplier to auto OEMs Electro-mechanical Systems Active vibration control systems Magnetically responsive devices Patented technologyRotary wing first to market Passive
Vibration Control Engine attachment systems High capacity laminate bearings for helicoptersElastomer mounts for vehicles Expertise in materials, stress measurement, vibration, motion control Longstanding customer relationships Critical
solutions for high cost of failure applications Low cost to value ratio Trusted, safe and reliable Key Technologies 9
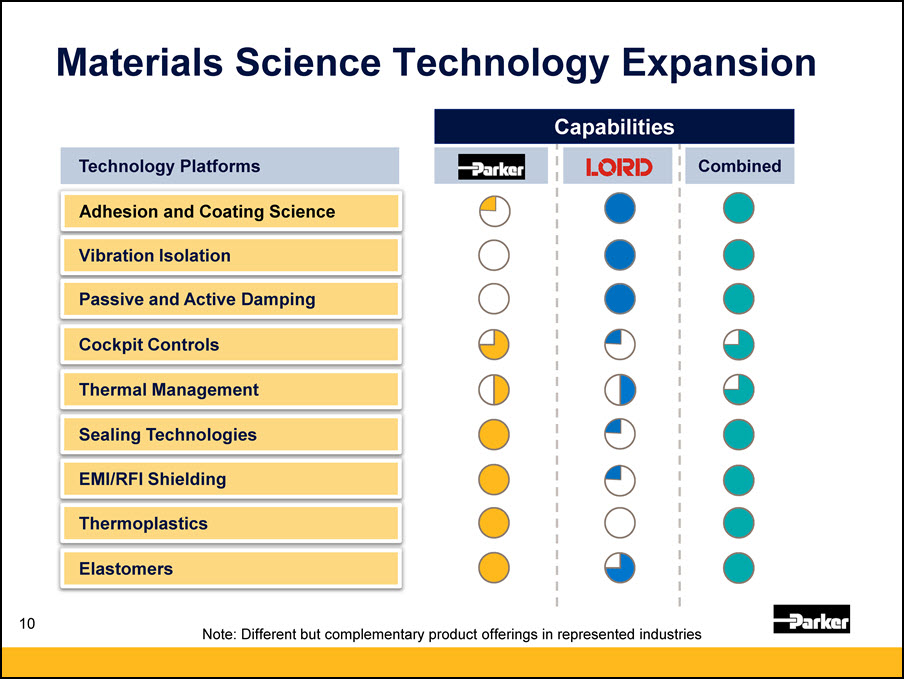
Materials Science Technology Expansion Technology
Platforms Combined Adhesion and Coating Science Vibration Isolation Passive and Active Damping Cockpit Controls Thermal Management Sealing Technologies EMI/RFI
Shielding Thermoplastics Elastomers Note: Different but complementary product offerings in represented industries Capabilities 10
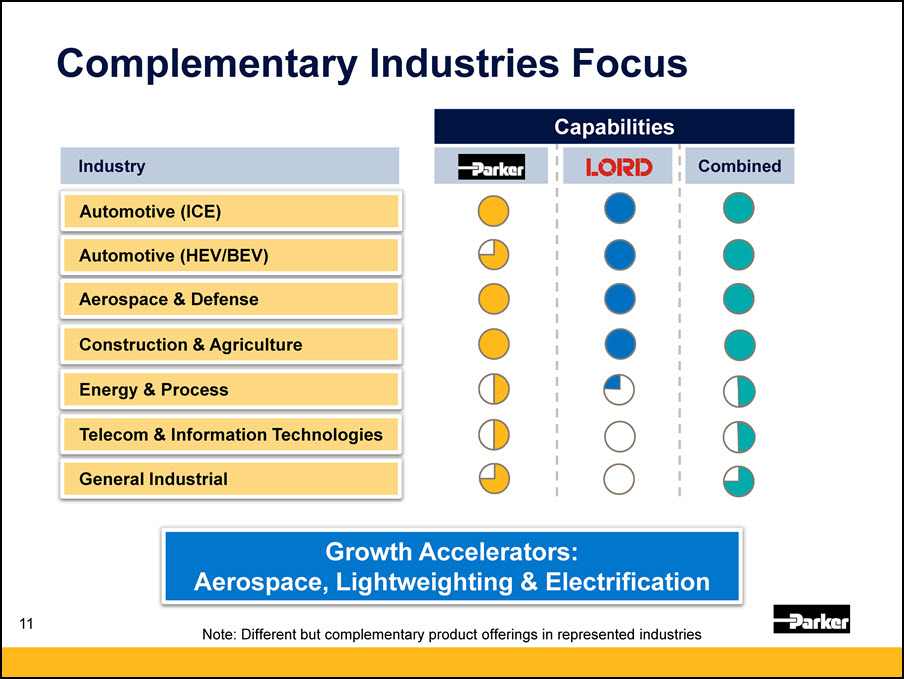
Industry Combined Automotive (ICE) Automotive (HEV/BEV) Aerospace &
Defense Construction & Agriculture Energy & Process Telecom & Information Technologies General Industrial Note: Different but complementary product offerings in represented industries Capabilities 11 Complementary
Industries Focus Growth Accelerators:Aerospace, Lightweighting & Electrification
Leading Rubber to Substrate Applications 12 Wide spectrum of adhesives for bonding rubber to various
substrates, coatings used to enhance rubber surfaces, and other specialty adhesives Most trusted adhesive in the marketA solution for every processA solution for every elastomer to substrateA solution for every environment
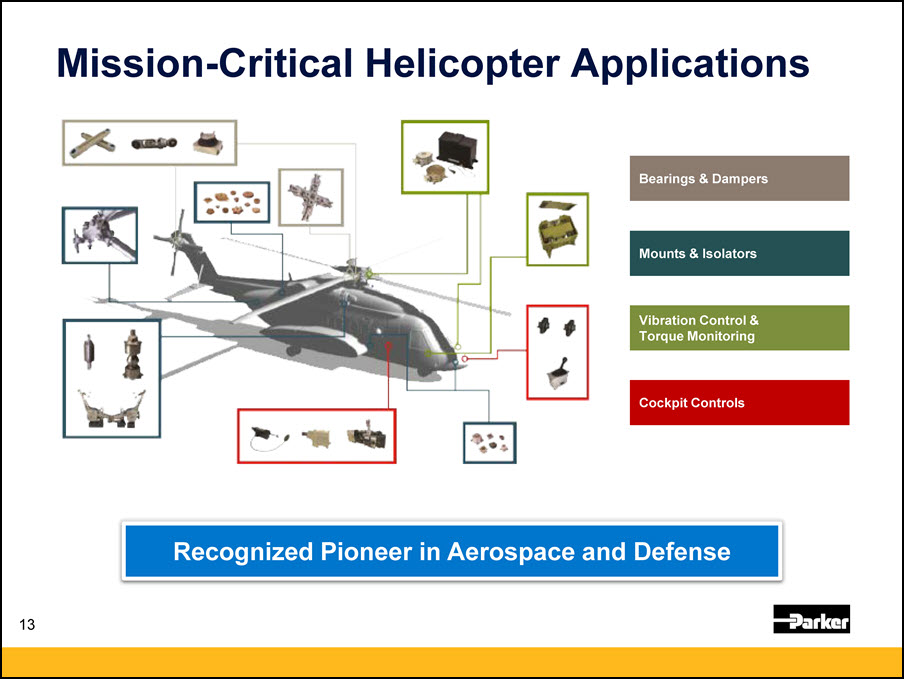
Mission-Critical Helicopter Applications 13 Vibration Control & Torque Monitoring Bearings &
Dampers Cockpit Controls Mounts & Isolators Recognized Pioneer in Aerospace and Defense
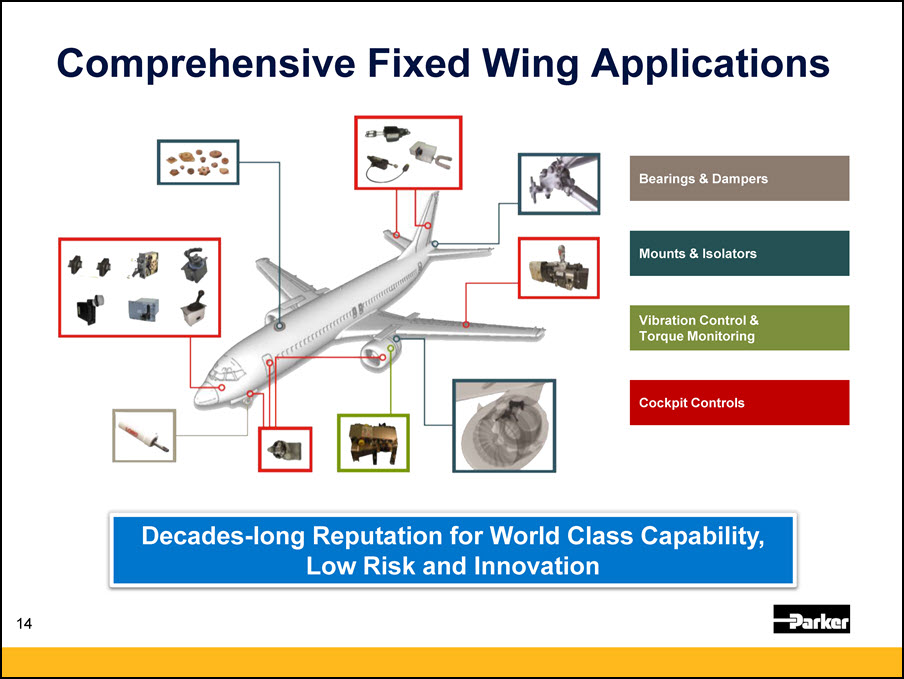
Comprehensive Fixed Wing Applications 14 Decades-long Reputation for World Class Capability, Low Risk
and Innovation Vibration Control & Torque Monitoring Bearings & Dampers Cockpit Controls Mounts & Isolators
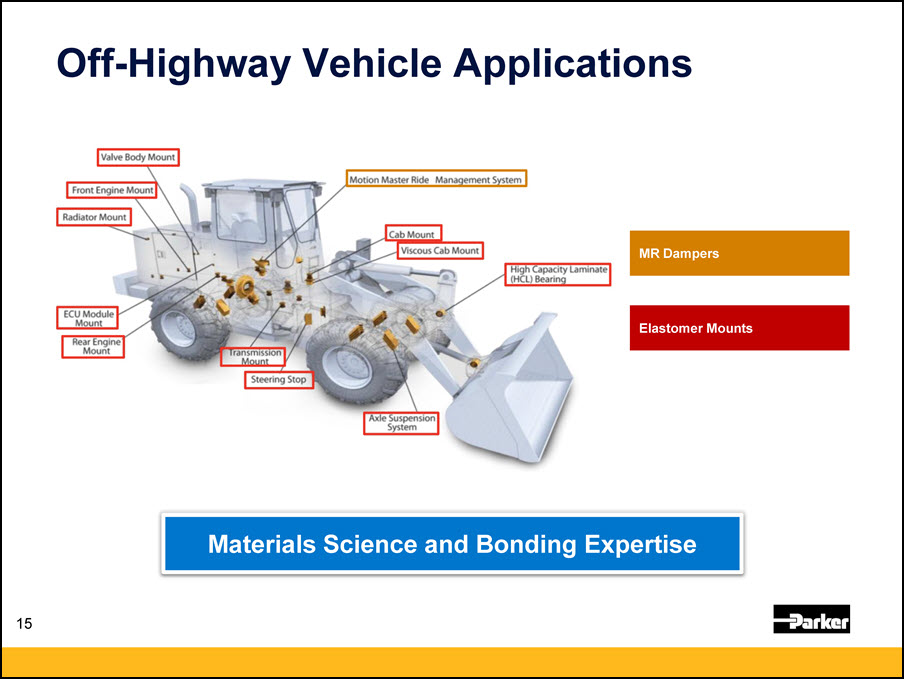
MR Dampers Elastomer Mounts Off-Highway Vehicle Applications 15 Materials Science and Bonding
Expertise
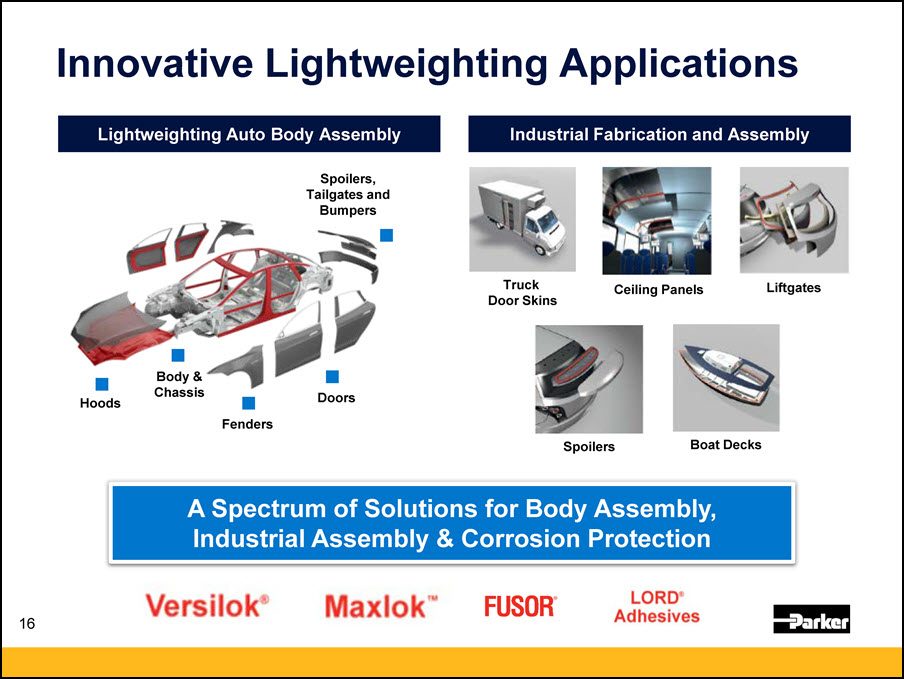
Innovative Lightweighting Applications Spoilers,Tailgates andBumpers Doors Fenders Hoods Body
&Chassis Lightweighting Auto Body Assembly Industrial Fabrication and Assembly Boat Decks Spoilers Truck Door Skins Liftgates Ceiling Panels A Spectrum of Solutions for Body Assembly, Industrial Assembly & Corrosion
Protection 16
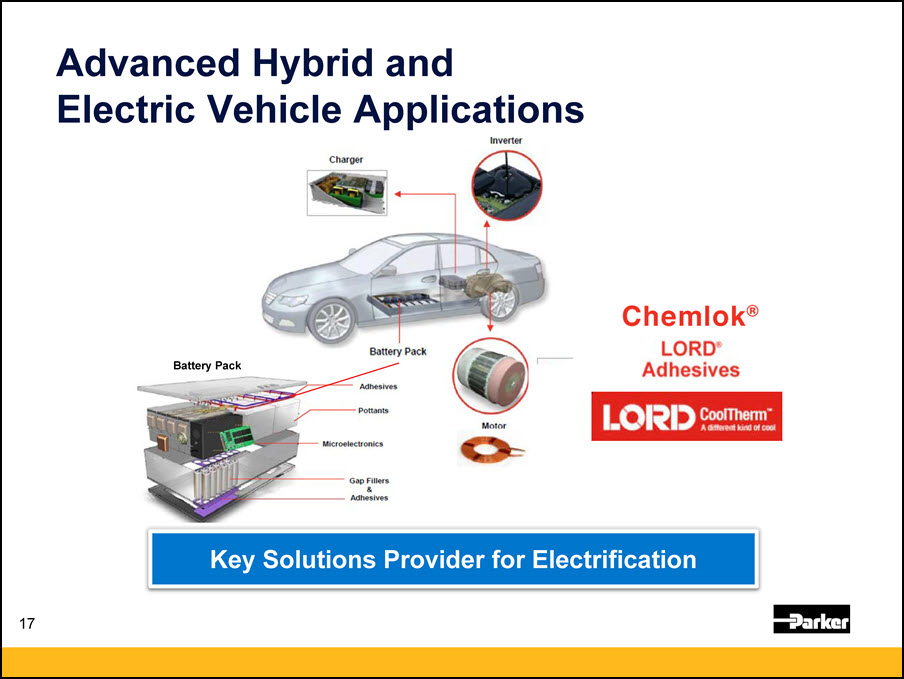
Advanced Hybrid and Electric Vehicle Applications Battery Pack Key Solutions Provider for
Electrification 17
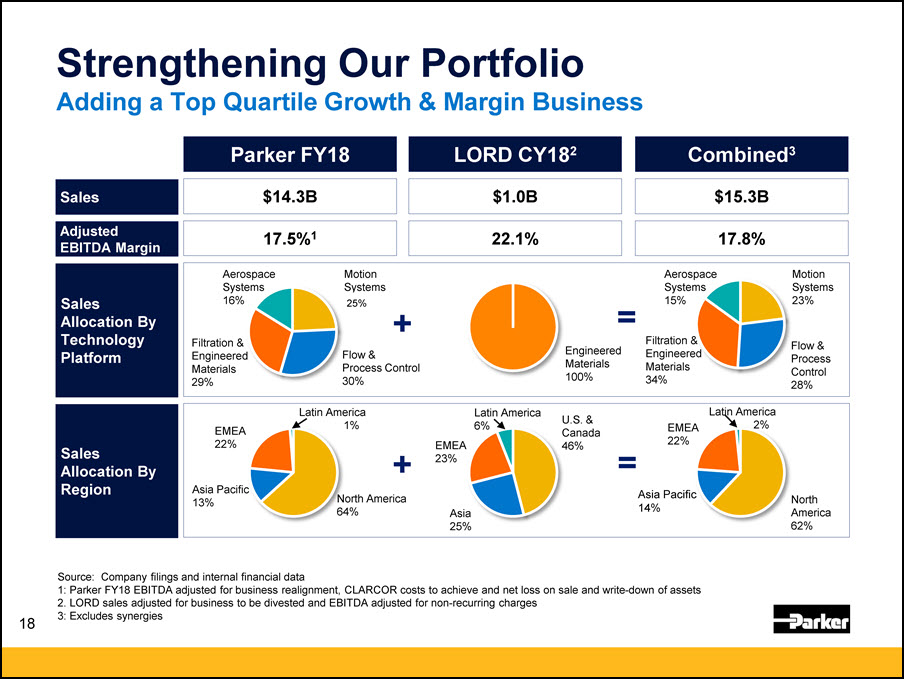
Strengthening Our PortfolioAdding a Top Quartile Growth & Margin Business Source: Company filings
and internal financial data1: Parker FY18 EBITDA adjusted for business realignment, CLARCOR costs to achieve and net loss on sale and write-down of assets 2. LORD sales adjusted for business to be divested and EBITDA adjusted for non-recurring
charges3: Excludes synergies Engineered Materials 100% + = Parker FY18 LORD CY182 Combined3 + = $1.0B $14.3B $15.3B 22.1% 17.5%1 17.8% Sales Allocation By Region Sales Adjusted EBITDA Margin Motion Systems24% Flow &
Process Control30% Filtration &EngineeredMaterials29% AerospaceSystems16% Sales Allocation ByTechnology Platform Motion Systems23% Flow & Process Control28% Filtration &EngineeredMaterials34% AerospaceSystems15% North
America64% EMEA22% U.S. &Canada46% Asia25% EMEA23% Latin America6% NorthAmerica62% Asia Pacific13% Latin America 1% EMEA22% Latin America 2% 25% 18
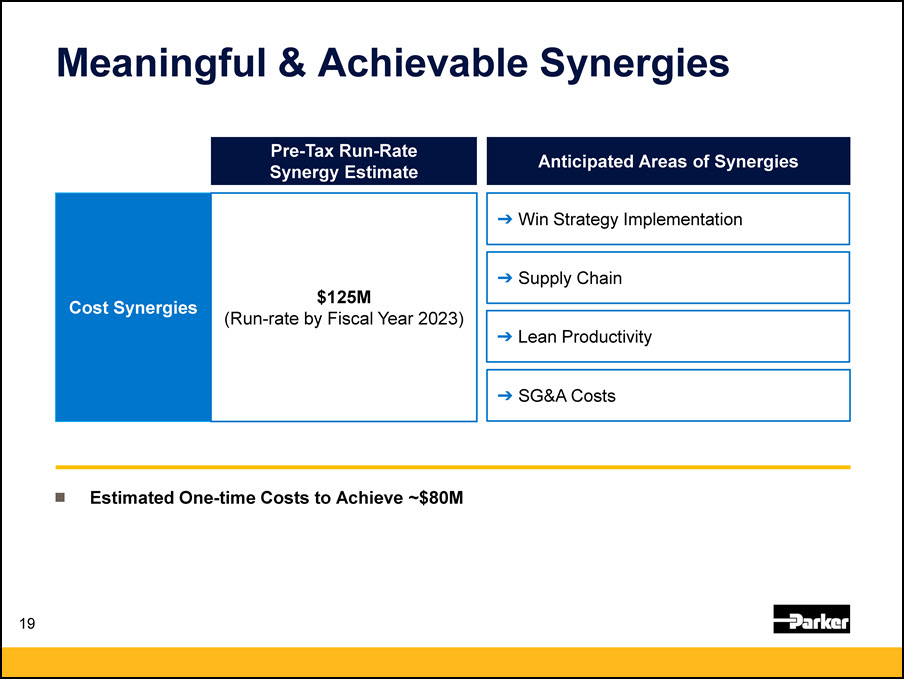
Meaningful & Achievable Synergies Anticipated Areas of Synergies Pre-Tax Run-RateSynergy
Estimate Cost Synergies $125M(Run-rate by Fiscal Year 2023) Estimated One-time Costs to Achieve ~$80M Win Strategy Implementation Supply Chain Lean Productivity SG&A Costs 19
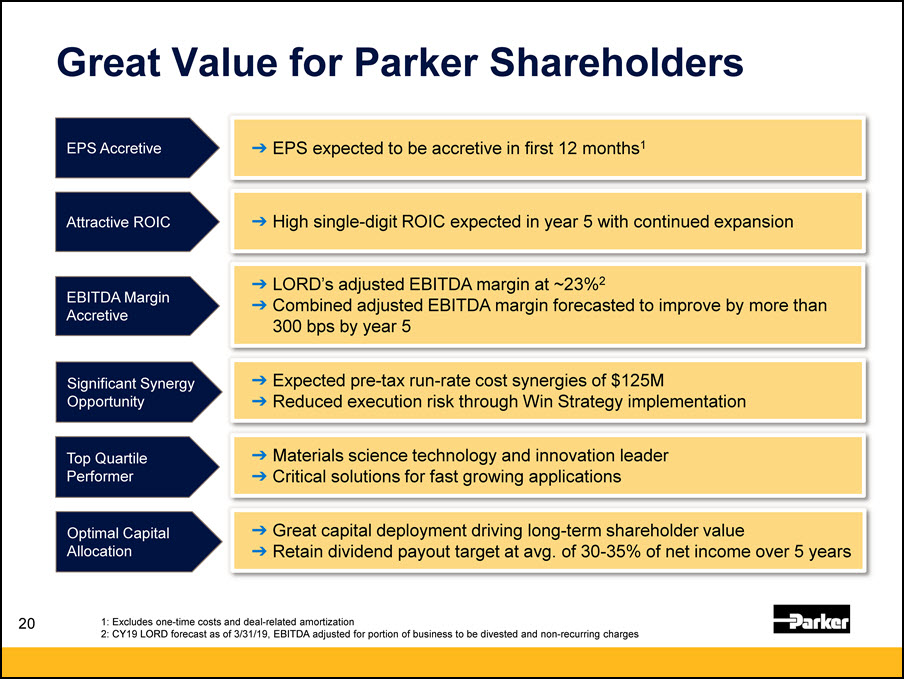
Great Value for Parker Shareholders EPS expected to be accretive in first 12 months1 High single-digit
ROIC expected in year 5 with continued expansion LORD’s adjusted EBITDA margin at ~23%2Combined adjusted EBITDA margin forecasted to improve by more than 300 bps by year 5 Expected pre-tax run-rate cost synergies of $125MReduced execution
risk through Win Strategy implementation Materials science technology and innovation leaderCritical solutions for fast growing applications Great capital deployment driving long-term shareholder valueRetain dividend payout target at avg. of
30-35% of net income over 5 years EPS Accretive Attractive ROIC EBITDA Margin Accretive Significant Synergy Opportunity Top Quartile Performer Optimal Capital Allocation 1: Excludes one-time costs and deal-related amortization2: CY19
LORD forecast as of 3/31/19, EBITDA adjusted for portion of business to be divested and non-recurring charges 20

21

22 Appendix
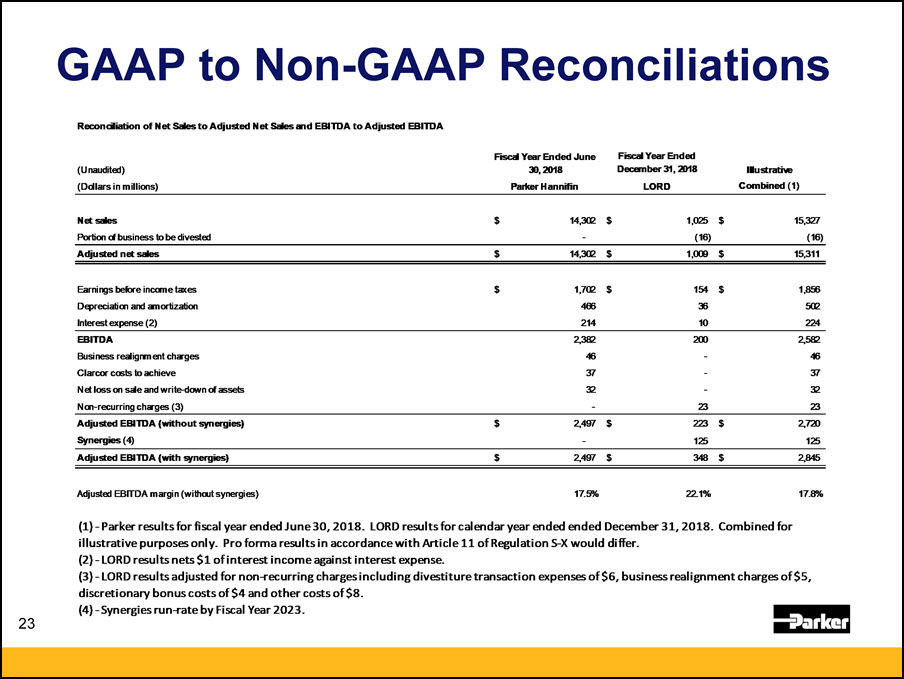
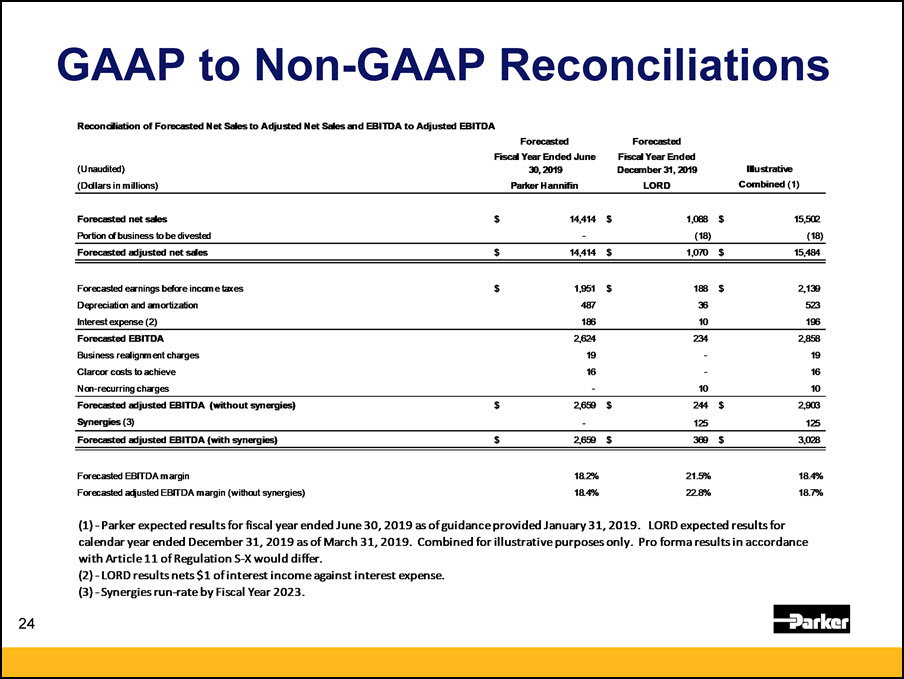
GAAP to Non-GAAP Reconciliations Reconciliation of Net Sales to Adjusted Net Sales
and EBITDA to Adjusted EBITDA Fiscal Year Ended June Fiscal Year Ended (Unaudited) 30,2018 December 31, 2018 Illustrative (Dollars in millions) Parker Hannifin LORD Combined (1) Net sales $ 14,31:12 $ 1,025 $ 15,327 Portion of business to
be divested - (16) (16) Adjusted net sales $ 14,302 $ 1,009 $ 15,311 Earnings before income taxes $ 1,702 $ 154 $ 1,856 Depreciation and amortization 406 36 502 Interest expense (2) 214 10 224 EBITDA 2,382 203 2,582 Business realignment
charges 46 - 46 Clarcor costs to achieve 37 - 37 Net loss on sale and write-down of assets 32 - 32 Nm-recurring charges (3) - 23 23 Adjusted EBITDA (without synergies) $ 2,497 $ 223 $ 2,720 Synergies (4) - 125 125 Adjusted EBITDA (with
synergies) $ 2,497 $ 348 $ 2,845 Adjusted EBITDA margin (without synergies) 17.5% 221% 17.8% (1) - Parker results for fiscal year ended June 30, 2018. LORD results for calendar year
ended December 31, 2018. Combined for illustrative purposes only. Pro forma results in accordance with Article 11 of Regulation 5-X would differ. LORD results nets $1 of interest income against interest expense. LORD results adjusted for
non-recurring charges including divestiture transaction expenses of $6, business realignment charges of $5, discretionary bonus costs of $4 and other costs of $8. (4) -Synergies run-rate by Fiscal Year 2023. 23
