Exhibit 99.2

Quarterly Earnings Release
3rd Quarter FY 2003
April 15, 2003


Forward-Looking Statements:
Forward-looking statements contained in this and other written and oral reports are made based on known events and circumstances at the time of release, and as such, are subject in the future to unforeseen uncertainties and risks. All statements regarding future performance, earnings projections, events or developments are forward-looking statements. It is possible that the company’s future performance and earnings projections may differ materially from current expectations, depending on economic conditions within both its industrial and aerospace markets, and the company’s ability to achieve anticipated benefits associated with announced realignment activities and strategic initiatives to improve operating margins. Among the other factors which may affect future performance are: changes in business relationships with and purchases by or from major customers or suppliers, including delays or cancellations in shipments; uncertainties surrounding timing, successful completion or integration of acquisitions; threats associated with and efforts to combat terrorism, including the war with Iraq; the impact of Severe Acute Respiratory Syndrome (SARS) on global travel; competitive market conditions and resulting effects on sales and pricing; increases in raw-material costs that cannot be recovered in product pricing; and global economic factors, including currency exchange rates, difficulties entering new markets and general economic conditions such as interest rates. The company makes these statements as of the date of this disclosure, and undertakes no obligation to update them.

| Ÿ |
Regulation G | |
| Ÿ |
EPS | |
| Ÿ |
Acquisition/Divestiture Update | |
| Ÿ |
Financial Results | |
| Ÿ |
Fiscal Year 2003 Outlook | |
| Ÿ |
Questions & Answers |

| • | Effective March 28, 2003 |
| • | Addresses use of non-GAAP financial measures |
| • | Parker has modified quarterly release to comply with Reg. G |
| • | Slide presentation has changed |

This presentation reconciles sales amounts reported in accordance with U.S. GAAP to sales amounts adjusted to remove the effects of acquisitions and divestitures made within the prior four quarters as well as the effects of currency exchange rates on sales. The effects of acquisitions and divestitures and currency exchange rates are removed to allow investors and the company to meaningfully evaluate changes in sales on a comparable basis from period to period.
EPS - 3rd Quarter
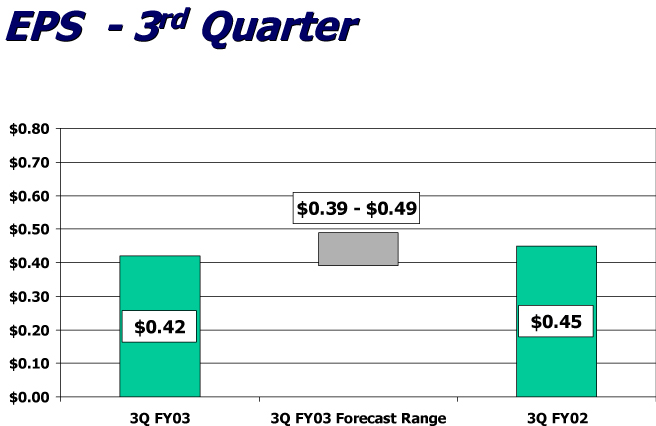
Note: EPS was reduced by business realignment charges of $0.04 and $0.02 in 3Q FY03 and 3Q FY02, respectively. The 3Q FY03 Forecast Range was reduced by $0.04 of business realignment charges.
EPS - YTD
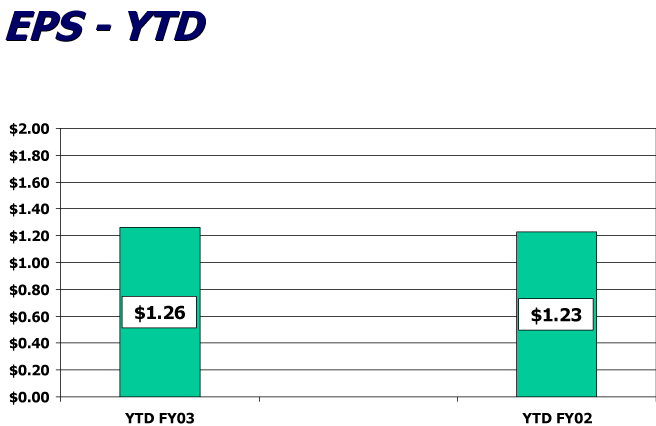
Note: EPS was reduced by $0.10 and $0.13 in the FY03 and the FY02, respectively, for business realignment charges and an equity investment adjustment.

| Name |
Date |
Sales |
Description | |||
| MTS Automation |
Apr 11, 2003 |
$25.5 M |
Custom motor business |

| FY 2003 |
FY 2002 | ||||||
| Sales |
$ |
1,646.8 |
|
$ |
1,578.3 | ||
| % change |
|
4.3 |
% |
||||
| Sales from acquisitions & divestitures |
$ |
18.9 |
|
$ |
28.9 | ||
| Sales without acquisitions & divestitures |
$ |
1,627.9 |
|
$ |
1,549.4 | ||
| % change |
|
5.1 |
% |
||||
| Currency effects |
$ |
70.5 |
|
||||
| Sales without acquisitions, divestitures & currency |
$ |
1,557.4 |
|
$ |
1,549.4 | ||
| % change |
|
0.5 |
% |
||||

| FY 2003 |
FY 2002 |
|||||||||||||||||||
| % of Sales |
Business Realignment |
% of Sales |
Business Realignment |
|||||||||||||||||
| Net sales |
$ |
1,646.8 |
|
100.0 |
% |
$ |
1,578.3 |
|
100.0 |
% |
||||||||||
| Cost of sales |
|
1,368.4 |
|
83.1 |
% |
7.4 |
|
|
1,309.2 |
|
83.0 |
% |
3.3 |
| ||||||
| Gross profit |
|
278.4 |
|
16.9 |
% |
(7.4 |
) |
|
269.1 |
|
17.0 |
% |
(3.3 |
) | ||||||
| S, G & A |
|
182.4 |
|
11.1 |
% |
0.1 |
|
|
171.8 |
|
10.9 |
% |
0.3 |
| ||||||
| Goodwill impairment loss |
|
— |
|
0.0 |
% |
— |
|
|
— |
|
0.0 |
% |
— |
| ||||||
| Other income (deductions) |
||||||||||||||||||||
| Interest expense |
|
(20.3 |
) |
-1.2 |
% |
— |
|
|
(20.9 |
) |
-1.3 |
% |
— |
| ||||||
| Interest and other income |
|
(1.7 |
) |
-0.1 |
% |
— |
|
|
0.2 |
|
0.0 |
% |
— |
| ||||||
|
|
(22.0 |
) |
-1.3 |
% |
— |
|
|
(20.7 |
) |
-1.3 |
% |
— |
| |||||||
| Income before taxes |
|
74.0 |
|
4.5 |
% |
(7.5 |
) |
|
76.6 |
|
4.9 |
% |
(3.6 |
) | ||||||
| Income taxes |
|
25.3 |
|
1.5 |
% |
(2.5 |
) |
|
24.2 |
|
1.5 |
% |
(1.3 |
) | ||||||
| Net income |
$ |
48.7 |
|
3.0 |
% |
(5.0 |
) |
$ |
52.4 |
|
3.3 |
% |
(2.3 |
) | ||||||
* Business realignment primarily includes severance costs and costs related to the consolidation of manufacturing product lines.

| FY 2003 |
FY 2002 | ||||||
| Sales |
$ |
4,749.9 |
|
$ |
4,491.5 | ||
| % change |
|
5.8 |
% |
||||
| Sales from acquisitions & divestitures |
$ |
204.4 |
|
$ |
83.9 | ||
| Sales without acquisitions & divestitures |
$ |
4,545.5 |
|
$ |
4,407.6 | ||
| % change |
|
3.1 |
% |
||||
| Currency effects |
$ |
122.7 |
|
||||
| Sales without acquisitions, divestitures & currency |
$ |
4,422.8 |
|
$ |
4,407.6 | ||
| % change |
|
0.3 |
% |
||||

| FY 2003 |
FY 2002 |
|||||||||||||||||||
| % of Sales |
Business Realignment & Equity Adj. |
% of Sales |
Business Realignment & Equity Adj. |
|||||||||||||||||
| Net sales |
$ |
4,749.9 |
|
100.0 |
% |
$ |
4,491.5 |
|
100.0 |
% |
||||||||||
| Cost of sales |
|
3,927.1 |
|
82.7 |
% |
13.6 |
|
|
3,710.7 |
|
82.6 |
% |
14.3 |
| ||||||
| Gross profit |
|
822.8 |
|
17.3 |
% |
(13.6 |
) |
|
780.8 |
|
17.4 |
% |
(14.3 |
) | ||||||
| S, G & A |
|
535.8 |
|
11.3 |
% |
3.6 |
|
|
502.1 |
|
11.2 |
% |
6.7 |
| ||||||
| Goodwill impairment loss |
|
— |
|
0.0 |
% |
— |
|
|
— |
|
0.0 |
% |
— |
| ||||||
| Other income (deductions) |
||||||||||||||||||||
| Interest expense |
|
(59.4 |
) |
-1.3 |
% |
— |
|
|
(62.9 |
) |
-1.4 |
% |
— |
| ||||||
| Interest and other income |
|
(3.9 |
) |
-0.1 |
% |
— |
|
|
0.2 |
|
0.0 |
% |
— |
| ||||||
|
|
(63.3 |
) |
-1.3 |
% |
— |
|
|
(62.7 |
) |
-1.4 |
% |
— |
| |||||||
| Income before taxes |
|
223.7 |
|
4.7 |
% |
(17.2 |
) |
|
216.0 |
|
4.8 |
% |
(21.0 |
) | ||||||
| Income taxes |
|
76.5 |
|
1.6 |
% |
(4.9 |
) |
|
74.0 |
|
1.6 |
% |
(5.5 |
) | ||||||
| Net income |
$ |
147.2 |
|
3.1 |
% |
(12.3 |
) |
$ |
142.0 |
|
3.2 |
% |
(15.5 |
) | ||||||
* Business realignment primarily includes severance costs and costs related to the consolidation of manufacturing product lines.

| FY 2003 |
FY 2002 |
|||||||||||||||
| 3rd Qtr |
YTD |
3rd Qtr |
YTD |
|||||||||||||
| Sales |
||||||||||||||||
| As reported |
$ |
727.1 |
|
$ |
2,124.5 |
|
$ |
726.8 |
|
$ |
2,023.9 |
| ||||
| % change |
|
0.0 |
% |
|
5.0 |
% |
||||||||||
| Acquisitions |
$ |
4.4 |
|
$ |
89.5 |
|
$ |
0.0 |
|
$ |
0.0 |
| ||||
| without Acquisitions |
$ |
722.7 |
|
$ |
2,035.0 |
|
$ |
726.8 |
|
$ |
2,023.9 |
| ||||
| % change |
|
-0.6 |
% |
|
0.5 |
% |
||||||||||
| Currency effects |
$ |
(0.1 |
) |
$ |
(2.7 |
) |
$ |
0.0 |
|
$ |
0.0 |
| ||||
| without Acquisitions & Currency |
$ |
722.8 |
|
$ |
2,037.7 |
|
$ |
726.8 |
|
$ |
2,023.9 |
| ||||
| % change |
|
-0.6 |
% |
|
0.7 |
% |
||||||||||
| Operating margin |
||||||||||||||||
| As reported |
$ |
42.2 |
|
$ |
120.6 |
|
$ |
38.1 |
|
$ |
102.1 |
| ||||
| % of sales |
|
5.8 |
% |
|
5.7 |
% |
|
5.2 |
% |
|
5.0 |
% | ||||
| Business Realignment |
$ |
2.2 |
|
$ |
5.2 |
|
$ |
1.3 |
|
$ |
6.3 |
| ||||

| FY 2003 |
FY 2002 |
|||||||||||||||
| 3rd Qtr |
YTD |
3rd Qtr |
YTD |
|||||||||||||
| Sales |
||||||||||||||||
| As reported |
$ |
416.4 |
|
$ |
1,156.0 |
|
$ |
325.8 |
|
$ |
912.5 |
| ||||
| % change |
|
27.8 |
% |
|
26.7 |
% |
||||||||||
| Acquisitions |
$ |
14.5 |
|
$ |
95.2 |
|
$ |
0.0 |
|
$ |
0.0 |
| ||||
| without Acquisitions |
$ |
401.9 |
|
$ |
1,060.8 |
|
$ |
325.8 |
|
$ |
912.5 |
| ||||
| % change |
|
23.3 |
% |
|
16.3 |
% |
||||||||||
| Currency effects |
$ |
56.6 |
|
$ |
99.2 |
|
$ |
0.0 |
|
$ |
0.0 |
| ||||
| without Acquisitions & Currency |
$ |
345.3 |
|
$ |
961.6 |
|
$ |
325.8 |
|
$ |
912.5 |
| ||||
| % change |
|
6.0 |
% |
|
5.4 |
% |
||||||||||
| Operating margin |
||||||||||||||||
| As reported |
$ |
23.9 |
|
$ |
72.8 |
|
$ |
17.1 |
|
$ |
50.2 |
| ||||
| % of sales |
|
5.7 |
% |
|
6.3 |
% |
|
5.2 |
% |
|
5.5 |
% | ||||
| Business Realignment |
$ |
3.2 |
|
$ |
6.1 |
|
$ |
1.2 |
|
$ |
3.4 |
| ||||

| FY 2003 |
FY 2002 |
|||||||||||||||
| 3rd Qtr |
YTD |
3rd Qtr |
YTD |
|||||||||||||
| Sales |
||||||||||||||||
| As reported |
$ |
280.0 |
|
$ |
832.7 |
|
$ |
285.0 |
|
$ |
885.8 |
| ||||
| % change |
|
-1.8 |
% |
|
-6.0 |
% |
||||||||||
| Acquisitions |
$ |
0.0 |
|
$ |
0.0 |
|
$ |
0.0 |
|
$ |
0.0 |
| ||||
| without Acquisitions |
$ |
280.0 |
|
$ |
832.7 |
|
$ |
285.0 |
|
$ |
885.8 |
| ||||
| % change |
|
-1.8 |
% |
|
-6.0 |
% |
||||||||||
| Currency effects |
$ |
2.4 |
|
$ |
4.5 |
|
$ |
0.0 |
|
$ |
0.0 |
| ||||
| without Acquisition & Currency |
$ |
277.6 |
|
$ |
828.2 |
|
$ |
285.0 |
|
$ |
885.8 |
| ||||
| % change |
|
-2.6 |
% |
|
-6.5 |
% |
||||||||||
| Operating margin |
||||||||||||||||
| As reported |
$ |
38.1 |
|
$ |
123.3 |
|
$ |
48.7 |
|
$ |
152.0 |
| ||||
| % of sales |
|
13.6 |
% |
|
14.8 |
% |
|
17.1 |
% |
|
17.2 |
% | ||||
| Business Realignment |
$ |
0.2 |
|
$ |
1.0 |
|
$ |
0.5 |
|
$ |
3.5 |
| ||||

| FY 2003 |
FY 2002 |
|||||||||||||||
| 3rd Qtr |
YTD |
3rd Qtr |
YTD |
|||||||||||||
| Sales |
||||||||||||||||
| As reported |
$ |
223.3 |
|
$ |
636.7 |
|
$ |
240.8 |
|
$ |
669.3 |
| ||||
| % change |
|
-7.3 |
% |
|
-4.9 |
% |
||||||||||
| Acquisitions & divestitures |
$ |
0.0 |
|
$ |
19.8 |
|
$ |
28.9 |
|
$ |
83.9 |
| ||||
| without acquisitions & divestitures |
$ |
223.3 |
|
$ |
616.9 |
|
$ |
211.9 |
|
$ |
585.4 |
| ||||
| % change |
|
5.4 |
% |
|
5.4 |
% |
||||||||||
| Currency effects |
$ |
11.6 |
|
$ |
21.6 |
|
$ |
0.0 |
|
$ |
0.0 |
| ||||
| without acquisitions, divestitures & currency |
$ |
211.7 |
|
$ |
595.3 |
|
$ |
211.9 |
|
$ |
585.4 |
| ||||
| % change |
|
-0.1 |
% |
|
1.7 |
% |
||||||||||
| Operating margin |
||||||||||||||||
| As reported |
$ |
20.0 |
|
$ |
51.3 |
|
$ |
18.4 |
|
$ |
44.8 |
| ||||
| % of sales |
|
9.0 |
% |
|
8.1 |
% |
|
7.6 |
% |
|
6.7 |
% | ||||
| Business Realignment |
$ |
1.9 |
|
$ |
2.2 |
|
$ |
0.6 |
|
$ |
2.7 |
| ||||
| Divestitures |
$ |
(1.8 |
) |
$ |
(5.7 |
) | ||||||||||

| as of March 31 |
2003 |
2002 |
Change |
|||||||
| Assets |
||||||||||
| Current Assets: |
||||||||||
| Cash and cash equivalents |
$ |
52.7 |
$ |
31.9 |
$ |
20.8 |
| |||
| Restricted investments |
|
— |
|
98.9 |
|
(98.9 |
) | |||
| Accounts receivable, net |
|
991.1 |
|
982.0 |
|
9.1 |
| |||
| Inventories |
|
1,027.9 |
|
1,070.3 |
|
(42.4 |
) | |||
| Prepaid exepenses |
|
43.4 |
|
42.2 |
|
1.2 |
| |||
| Deferred income taxes |
|
85.3 |
|
98.7 |
|
(13.4 |
) | |||
| Total current assets |
$ |
2,200.4 |
$ |
2,324.0 |
$ |
(123.6 |
) | |||
| Plant & equipment, net |
|
1,661.7 |
|
1,683.8 |
|
(22.1 |
) | |||
| Goodwill |
|
1,091.8 |
|
1,099.4 |
|
(7.6 |
) | |||
| Intangible assets, net |
|
56.2 |
|
43.7 |
|
12.5 |
| |||
| Other assets |
|
746.0 |
|
604.1 |
|
141.9 |
| |||
| Total assets |
$ |
5,756.1 |
$ |
5,755.0 |
$ |
1.1 |
| |||

| as of March 31 |
2003 |
2002 |
Change |
|||||||
| Liabilities and shareholders’ equity |
||||||||||
| Current liabilities: |
||||||||||
| Notes payable |
$ |
410.3 |
$ |
547.8 |
$ |
(137.5 |
) | |||
| Accounts payable |
|
395.7 |
|
379.0 |
|
16.7 |
| |||
| Accrued liabilities |
|
468.7 |
|
483.6 |
|
(14.9 |
) | |||
| Accrued domestic and foreign taxes |
|
34.7 |
|
73.2 |
|
(38.5 |
) | |||
| Total current liabilities |
$ |
1,309.4 |
$ |
1,483.6 |
$ |
(174.2 |
) | |||
| Long-term debt |
|
948.2 |
|
1,052.2 |
|
(104.0 |
) | |||
| Pension and other postretirement benefits |
|
515.3 |
|
209.1 |
|
306.2 |
| |||
| Deferred income taxes |
|
133.2 |
|
147.7 |
|
(14.5 |
) | |||
| Other liabilities |
|
126.1 |
|
236.2 |
|
(110.1 |
) | |||
| Shareholders’ equity |
|
2,723.9 |
|
2,626.2 |
|
97.7 |
| |||
| Total liabilities and shareholders’ equity |
$ |
5,756.1 |
$ |
5,755.0 |
$ |
1.1 |
| |||

| nine months ended March 31 |
2003 |
2002 |
||||||
| Net income |
$ |
147.2 |
|
$ |
142.0 |
| ||
| Depreciation & amortization |
|
191.0 |
|
|
181.0 |
| ||
| Net change in receivables, inventory & payables |
|
32.2 |
|
|
80.3 |
| ||
| Net change in other assets & liabilities |
|
(98.5 |
) |
|
42.7 |
| ||
| Other, net |
|
54.3 |
|
|
12.0 |
| ||
| Net cash provided by operating activities |
$ |
326.2 |
|
$ |
458.0 |
| ||
| Acquisitions |
$ |
(2.0 |
) |
$ |
(383.1 |
) | ||
| Capital expenditures |
|
(112.9 |
) |
|
(157.5 |
) | ||
| Other |
|
13.8 |
|
|
(38.5 |
) | ||
| Net cash used in investing activities |
$ |
(101.1 |
) |
$ |
(579.1 |
) | ||
| Common share activity |
$ |
3.1 |
|
$ |
3.9 |
| ||
| (Payments of) proceeds from debt, net |
|
(160.1 |
) |
|
190.2 |
| ||
| Dividends |
|
(63.7 |
) |
|
(62.1 |
) | ||
| Net cash (used in) provided by financing activities |
$ |
(220.7 |
) |
$ |
132.0 |
| ||
| Effect of exchange rate changes on cash |
|
1.9 |
|
|
(2.6 |
) | ||
| Net increase in cash and cash equivalents |
$ |
6.3 |
|
$ |
8.3 |
| ||
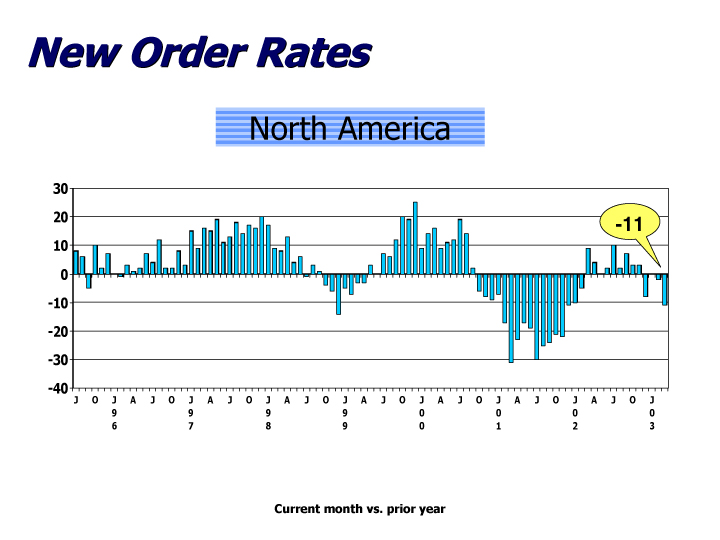

| • | Daily order rates in March down from February |
| • | Customers remain cautious regarding capital expenditures |
| • | Inventories at customers and distributors seem to be balanced with demand |
| • | Capacity utilization remains low |
| • | Potential exists in deferred MRO |
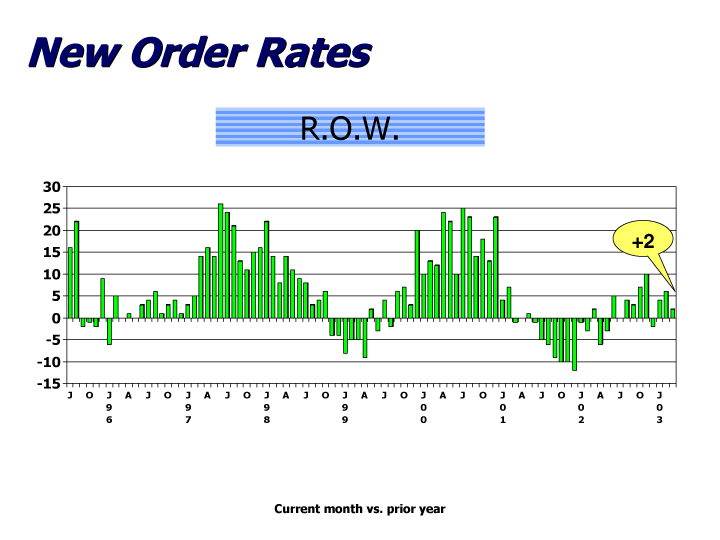

| • | Daily order rates showing steady growth since Sept. 2002 |
| • | Europe slightly negative and remains volatile |
| • | Asia-Pacific positive trend continues |
| • | Latin America also remains positive |
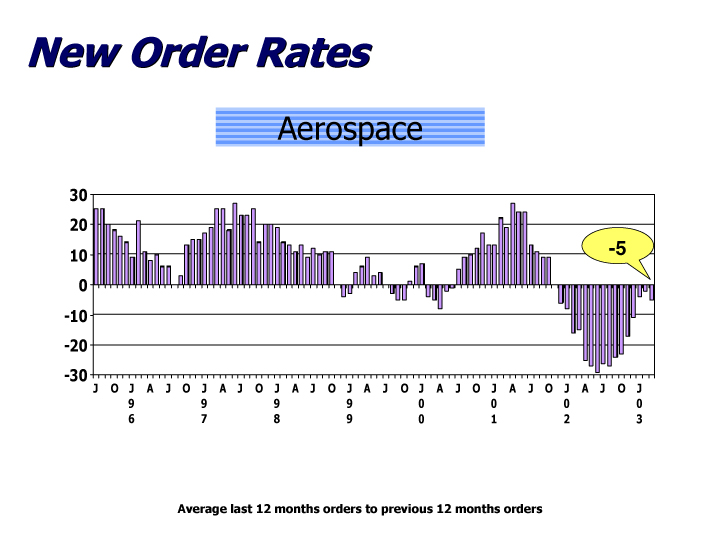

| • | Commercial OEM and MRO under pressure due to Iraq and SARS |
| • | Military trend is positive due to defense spending |
.

| • | Current economic conditions expected to continue |
| • | Uncertainty with Iraq |
| • | Lack of capital spending |
| • | Win Strategy initiatives continue to be positive to operating earnings |
| • | Any real volume growth (i.e., excluding currency exchange rates) should benefit operating earnings |