
Exhibit 99.2


Quarterly Earnings Release
4 th Quarter FY 2003
July 29, 2003


Forward-Looking Statements:
Forward-looking statements contained in this and other written and oral reports are made based on known events and circumstances at the time of release, and as such, are subject in the future to unforeseen uncertainties and risks. All statements regarding future performance, earnings projections, events or developments are forward-looking statements. It is possible that the future performance and earnings projections of the company and individual segments may differ materially from current expectations, depending on economic conditions within both its industrial and aerospace markets, and the company’s ability to achieve anticipated benefits associated with announced realignment activities, strategic initiatives to improve operating margins, and growth initiatives. A change in economic conditions in individual markets may have a particularly volatile effect on segment projections.Among the other factors which may affect future performance are: changes in business relationships with and purchases by or from major customers or suppliers, including delays or cancellations in shipments; uncertainties surrounding timing, successful completion or integration of acquisitions; threats associated with and efforts to combat terrorism; competitive market conditions and resulting effects on sales and pricing; increases in raw-material costs that cannot be recovered in product pricing; and global economic factors, including currency exchange rates, difficulties entering new markets and general economic conditions such as interest rates. The company makes these statements as of the date of this disclosure, and undertakes no obligation to update them.

| Ø | EPS |
| Ø | Acquisition/Divestiture Update |
| Ø | Financial Results |
| Ø | Fiscal Year 2004 Outlook |
| Ø | Questions & Answers |

This presentation reconciles sales amounts reported in accordance with U.S. GAAP to sales amounts adjusted to remove the effects of acquisitions and divestitures made within the prior four quarters as well as the effects of currency exchange rates on sales. The effects of acquisitions and divestitures and currency exchange rates are removed to allow investors and the company to meaningfully evaluate changes in sales on a comparable basis from period to period.
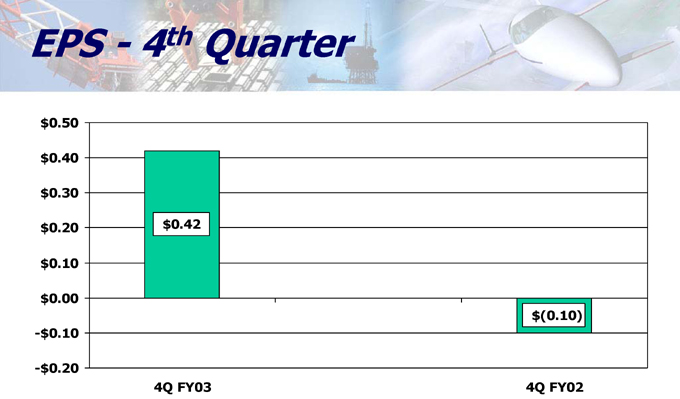
Note: 4Q FY03 EPS was reduced by $0.06 for business realignment charges, offset by a $0.04 gain on the sale of a non-core business. 4Q FY02 EPS was reduced by $0.12 for business realignment charges and $0.32 for goodwill impairment.
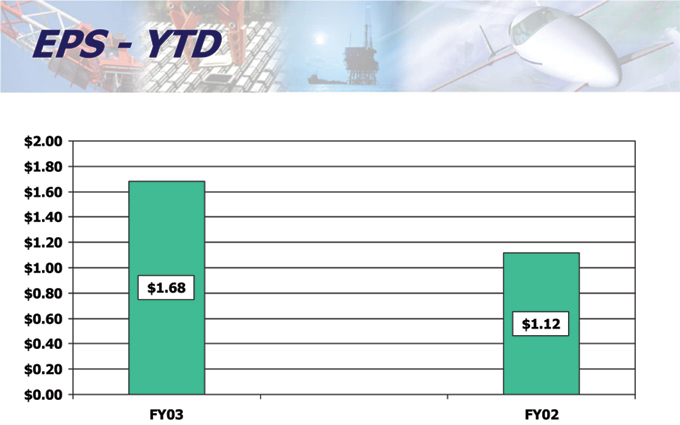
Note: FY03 EPS was reduced by $0.14 for business realignment charges and $0.02 for an equity investment adjustment, offset by a $0.04 gain on the sale of a non-core business. FY02 EPS was reduced by $0.21 for business realignment charges, $0.04 for an equity investment adjustment, and $0.32 for goodwill impairment.

| Name |
Date |
Sales |
Description | |||
| Acquisitions: |
||||||
| MTS Automation |
Apr 11, 2003 | $25.5M | Custom motor business | |||
| Divestitures: |
||||||
| UAP Division |
Jun 2, 2003 | $20.0 M | sold to Triumph Group | |||

| FY 2003 |
FY 2002 | |||
| Sales |
$1,660.7 | $1,657.6 | ||
| % change |
0.2% | |||
| Sales from acquisitions & divestitures |
$11.8 | $1.8 | ||
| Sales without acquisitions & divestitures |
$1,648.9 | $1,655.8 | ||
| % change |
-0.4% | |||
| Currency effects |
$69.4 | |||
| Sales without acquisitions, divestitures & currency |
$1,579.5 | $1,655.8 | ||
| % change |
-4.6% |

| FY 2003 |
FY 2002 |
|||||||||||||||||
| % of Sales |
Business Realignment & Equity Adj. |
Divestiture |
% of Sales |
Business Realignment & Equity Adj. |
||||||||||||||
| Net sales |
$1,660.7 | 100.0% | $1,657.6 | 100.0% | ||||||||||||||
| Cost of sales |
1,382.6 | 83.3% | $6.5 | $0.0 | 1,405.8 | 84.8% | $9.5 | |||||||||||
| Gross profit |
278.1 | 16.7% | (6.5 | ) | 0.0 | 251.8 | 15.2% | (9.5 | ) | |||||||||
| S, G & A |
185.3 | 11.2% | 0.0 | 0.0 | 184.4 | 11.1% | 2.2 | |||||||||||
| Goodwill impairment loss |
0.0 | 0.0% | 0.0 | 0.0 | 39.5 | 2.4% | 0.0 | |||||||||||
| Other income (deductions) |
||||||||||||||||||
| Interest expense |
(22.2 | ) | -1.3% | 0.0 | 0.0 | (19.6 | ) | -1.2% | 0.0 | |||||||||
| Interest & other income |
3.1 | 0.2% | (3.5 | ) | 7.4 | (6.3 | ) | -0.4% | (9.4 | ) | ||||||||
| (19.1 | ) | -1.2% | (3.5 | ) | 7.4 | (25.9 | ) | -1.6% | (9.4 | ) | ||||||||
| Income before taxes |
73.7 | 4.4% | (10.0 | ) | 7.4 | 2.0 | 0.1% | (21.1 | ) | |||||||||
| Income taxes |
24.6 | 1.5% | (3.5 | ) | 2.8 | 13.8 | 0.8% | (7.3 | ) | |||||||||
| Net income |
$49.1 | 3.0% | ($6.5 | ) | $4.6 | ($11.8 | ) | -0.7% | ($13.8 | ) | ||||||||
* Business realignment primarily includes severance costs and costs related to the consolidation of manufacturing product lines.

| FY 2003 |
FY 2002 | |||
| Sales |
$6,410.6 | $6,149.1 | ||
| % change |
4.3% | |||
| Sales from acquisitions & divestitures |
$216.8 | $85.8 | ||
| Sales without acquisitions & divestitures |
$6,193.8 | $6,063.3 | ||
| % change |
2.2% | |||
| Currency effects |
$192.1 | |||
| Sales without acquisitions, divestitures & currency |
$6,001.7 | $6,063.3 | ||
| % change |
-1.0% | |||

| FY 2003 |
FY 2002 |
|||||||||||||||||
| % of Sales |
Business Realignment & Equity Adj. |
Divestiture |
% of Sales |
Business Realignment & Equity Adj. |
||||||||||||||
| Net sales |
$6,410.6 | 100.0% | $6,149.1 | 100.0% | ||||||||||||||
| Cost of sales |
5,309.8 | 82.8% | $20.1 | $0.0 | 5,116.5 | 83.2% | $24.0 | |||||||||||
| Gross profit |
1,100.8 | 17.2% | (20.1 | ) | 0.0 | 1,032.6 | 16.8% | (24.0 | ) | |||||||||
| S, G & A |
721.1 | 11.2% | 3.6 | 0.0 | 686.5 | 11.2% | 9.0 | |||||||||||
| Goodwill impairment loss |
0.0 | 0.0% | 0.0 | 0.0 | 39.5 | 0.6% | 0.0 | |||||||||||
| Other income (deductions) |
||||||||||||||||||
| Interest expense |
(81.5 | ) | -1.3% | 0.0 | 0.0 | (82.5 | ) | -1.3% | 0.0 | |||||||||
| Interest & other income |
(0.8 | ) | 0.0% | (3.5 | ) | 7.4 | (6.0 | ) | -0.1% | (9.3 | ) | |||||||
| (82.3 | ) | -1.3% | (3.5 | ) | 7.4 | (88.5 | ) | -1.4% | (9.3 | ) | ||||||||
| Income before taxes |
297.4 | 4.6% | (27.2 | ) | 7.4 | 218.1 | 3.5% | (42.3 | ) | |||||||||
| Income taxes |
101.1 | 1.6% | (8.4 | ) | 2.8 | 87.9 | 1.4% | (12.9 | ) | |||||||||
| Net income |
$196.3 | 3.1% | ($18.8 | ) | $4.6 | $130.2 | 2.1% | ($29.4 | ) | |||||||||
* Business realignment primarily includes severance costs and costs related to the consolidation of manufacturing product lines.

| FY 2003 |
FY 2002 | |||||||||||||||
| 4th Qtr |
YTD |
4th Qtr |
YTD | |||||||||||||
| Sales |
||||||||||||||||
| As reported |
$716.1 | $2,840.6 | $768.4 | $2,792.3 | ||||||||||||
| % change |
-6.8% | 1.7% | ||||||||||||||
| Acquisitions |
$6.7 | $96.8 | $0.0 | $0.0 | ||||||||||||
| without Acquisitions |
$709.4 | $2,743.8 | $768.4 | $2,792.3 | ||||||||||||
| % change |
-7.7% | -1.7% | ||||||||||||||
| Currency effects |
$2.7 | $0.0 | $0.0 | $0.0 | ||||||||||||
| without Acquisitions & Currency |
$706.7 | $2,743.8 | $768.4 | $2,792.3 | ||||||||||||
| % change |
-8.0% | -1.7% | ||||||||||||||
| Operating margin |
||||||||||||||||
| As reported |
$34.6 | $155.3 | $39.2 | $141.3 | ||||||||||||
| % of sales |
4.8% | 5.5% | 5.1% | 5.1% | ||||||||||||
| Business Realignment |
$3.1 | $8.3 | $2.6 | $8.9 | ||||||||||||

| FY 2003 |
FY 2002 | |||||||||||||||
| 4th Qtr |
YTD |
4th Qtr |
YTD | |||||||||||||
| Sales |
||||||||||||||||
| As reported |
$428.4 | $1,584.4 | $366.2 | $1,278.7 | ||||||||||||
| % change |
17.0% | 23.9% | ||||||||||||||
| Acquisitions |
$5.1 | $100.2 | $0.0 | $0.0 | ||||||||||||
| without Acquisitions |
$423.3 | $1,484.2 | $366.2 | $1,278.7 | ||||||||||||
| % change |
15.6% | 16.1% | ||||||||||||||
| Currency effects |
$52.7 | $151.9 | $0.0 | $0.0 | ||||||||||||
| without Acquisitions & Currency |
$370.6 | $1,332.3 | $366.2 | $1,278.7 | ||||||||||||
| % change |
1.2% | 4.2% | ||||||||||||||
| Operating margin |
||||||||||||||||
| As reported |
$23.5 | $96.3 | $10.6 | $60.7 | ||||||||||||
| % of sales |
5.5% | 6.1% | 2.9% | 4.7% | ||||||||||||
| Business Realignment |
$1.8 | $7.9 | $3.7 | $12.3 | ||||||||||||

| FY 2003 |
FY 2002 | |||||||||||||||
| 4th Qtr |
YTD |
4th Qtr |
YTD | |||||||||||||
| Sales |
||||||||||||||||
| As reported |
$276.8 | $1,109.6 | $286.8 | $1,172.6 | ||||||||||||
| % change |
-3.5% | -5.4% | ||||||||||||||
| Acquisitions |
$0.0 | $0.0 | $0.0 | $0.0 | ||||||||||||
| without Acquisitions |
$276.8 | $1,109.6 | $286.8 | $1,172.6 | ||||||||||||
| % change |
-3.5% | -5.4% | ||||||||||||||
| Currency effects |
$1.9 | $6.4 | $0.0 | $0.0 | ||||||||||||
| without Acquisition & Currency |
$274.9 | $1,103.2 | $286.8 | $1,172.6 | ||||||||||||
| % change |
-4.1% | -5.9% | ||||||||||||||
| Operating margin |
||||||||||||||||
| As reported |
$34.0 | $157.3 | $37.3 | $189.4 | ||||||||||||
| % of sales |
12.3% | 14.2% | 13.0% | 16.2% | ||||||||||||
| Business Realignment |
$1.4 | $2.5 | $1.1 | $4.7 | ||||||||||||

| FY 2003 |
FY 2002 | |||||||||||||||
| 4th Qtr |
YTD |
4th Qtr |
YTD | |||||||||||||
| Sales |
||||||||||||||||
| As reported |
$181.4 | $665.6 | $185.4 | $612.5 | ||||||||||||
| % change |
-2.2% | 8.7% | ||||||||||||||
| Acquisitions |
$0.0 | $19.8 | $0.0 | $0.0 | ||||||||||||
| without Acquisitions |
$181.4 | $645.8 | $185.4 | $612.5 | ||||||||||||
| % change |
-2.2% | 5.4% | ||||||||||||||
| Currency effects |
$4.0 | $10.9 | $0.0 | $0.0 | ||||||||||||
| without Acquisitions & Currency |
$177.4 | $634.9 | $185.4 | $612.5 | ||||||||||||
| % change |
-4.3% | 3.7% | ||||||||||||||
| Operating margin |
||||||||||||||||
| As reported |
$19.1 | $63.4 | $16.9 | $48.0 | ||||||||||||
| % of sales |
10.5% | 9.5% | 9.1% | 7.8% | ||||||||||||
| Business Realignment |
$0.3 | $1.2 | $2.3 | $2.3 | ||||||||||||

| FY 2003 |
FY 2002 |
|||||||||||||||||
| 4th Qtr |
YTD |
4th Qtr |
YTD |
|||||||||||||||
| Sales |
||||||||||||||||||
| As reported |
$57.9 | $210.3 | $50.8 | $293.0 | ||||||||||||||
| % change |
14.0% | -28.2% | ||||||||||||||||
| Acquisitions & divestitures |
$0.0 | $0.0 | $1.8 | $85.8 | ||||||||||||||
| without acquisitions & divestitures |
$57.9 | $210.3 | $49.0 | $207.2 | ||||||||||||||
| % change |
18.2% | 1.5% | ||||||||||||||||
| Currency effects |
$8.0 | $22.7 | $0.0 | $0.0 | ||||||||||||||
| without acquisitions, divestitures & currency |
$49.9 | $187.6 | $49.0 | $207.2 | ||||||||||||||
| % change |
1.8% | -9.5% | ||||||||||||||||
| Operating margin |
||||||||||||||||||
| As reported |
$4.6 | $11.6 | ($7.0 | ) | $6.7 | |||||||||||||
| % of sales |
7.9% | 5.5% | -13.9% | 2.3% | ||||||||||||||
| Business Realignment |
$0.0 | $1.3 | $2.0 | $4.7 | ||||||||||||||
| Divestitures |
($0.3 | ) | ($5.3 | ) | ||||||||||||||

| FY 2003 |
FY 2002 | |||
| Industrial North America |
5.5% | 5.1% | ||
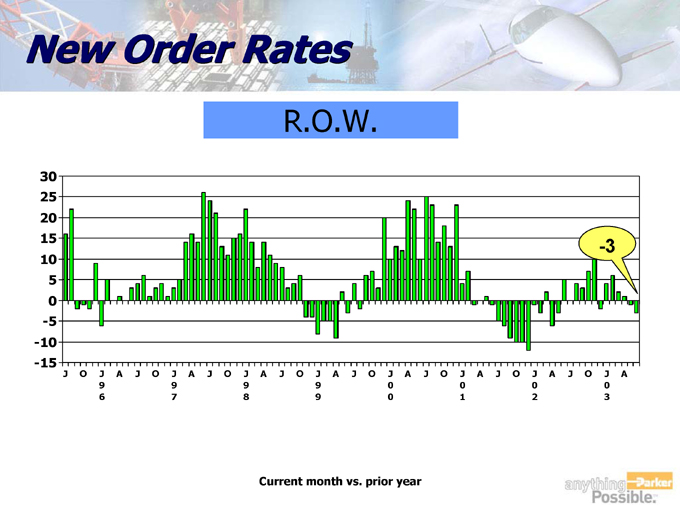
| Industrial ROW |
6.1% | 4.7% | ||
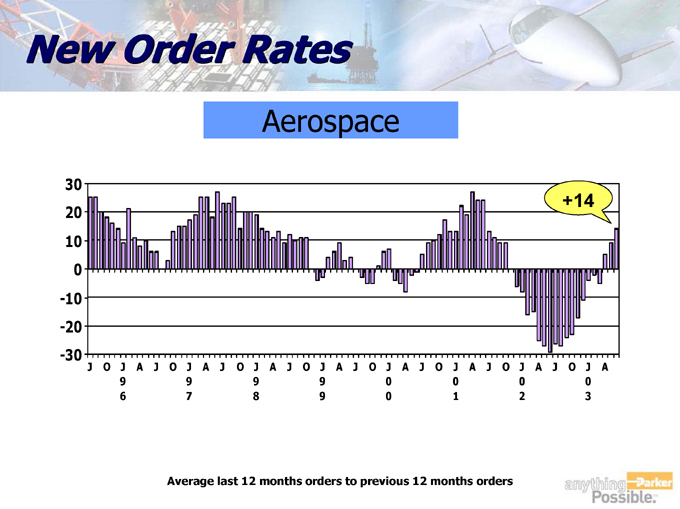
| Aerospace |
14.2% | 16.1% | ||
| Climate & Industrial Controls |
9.5% | 7.8% | ||
| Other |
5.5% | 2.3% | ||
| Total |
7.5% | 7.3% | ||
Increased operating margin 20 bps despite flat sales, Aerospace decline and $60 million increase in pension, insurance and medical.

| as of June 30 |
2003 |
2002 |
Change |
|||||||
| Assets: |
||||||||||
| Current Assets: |
||||||||||
| Cash and cash equivalents |
$ | 245.8 | $ | 46.4 | $ | 199.4 | ||||
| Accounts receivable, net |
1,002.1 | 1,006.3 | (4.2 | ) | ||||||
| Inventories |
997.2 | 1,052.0 | (54.8 | ) | ||||||
| Prepaid expenses |
51.9 | 48.5 | 3.4 | |||||||
| Deferred income taxes |
99.8 | 82.4 | 17.4 | |||||||
| Total current assets |
$ | 2,396.8 | $ | 2,235.6 | $ | 161.2 | ||||
| Plant & equipment, net |
1,657.4 | 1,697.0 | (39.6 | ) | ||||||
| Goodwill |
1,108.6 | 1,083.8 | 24.8 | |||||||
| Intangible assets, net |
59.4 | 51.3 | 8.1 | |||||||
| Other assets |
763.4 | 684.9 | 78.5 | |||||||
| Total assets |
$ | 5,985.6 | $ | 5,752.6 | $ | 233.0 | ||||

| as of June 30 |
2003 |
2002 |
Change |
|||||||
| Liabilities and shareholders' equity |
||||||||||
| Current liabilities: |
||||||||||
| Notes payable |
$ | 424.2 | $ | 416.7 | $ | 7.5 | ||||
| Accounts payable |
437.1 | 443.5 | (6.4 | ) | ||||||
| Accrued liabilities |
497.3 | 451.3 | 46.0 | |||||||
| Accrued domestic and foreign taxes |
65.1 | 48.3 | 16.8 | |||||||
| Total current liabilities |
$ | 1,423.7 | $ | 1,359.8 | $ | 63.9 | ||||
| Long-term debt |
966.3 | 1,088.9 | (122.6 | ) | ||||||
| Pension and other postretirement benefits |
920.4 | 508.3 | 412.1 | |||||||
| Deferred income taxes |
20.8 | 77.0 | (56.2 | ) | ||||||
| Other liabilities |
133.5 | 135.1 | (1.6 | ) | ||||||
| Shareholders' equity |
2,520.9 | 2,583.5 | (62.6 | ) | ||||||
| Total liabilities and shareholders' equity |
$ | 5,985.6 | $ | 5,752.6 | $ | 233.0 | ||||

| for the years ended June 30 |
2003 |
2002 |
||||||
| Net income |
$ | 196.3 | $ | 130.2 | ||||
| Depreciation & amortization |
259.2 | 281.6 | ||||||
| Net change in receivables, inventory & payables |
140.5 | 171.1 | ||||||
| Net change in other assets & liabilities |
(66.4 | ) | 1.4 | |||||
| Other, net |
27.9 | 46.7 | ||||||
| Net cash provided by operating activities |
$ | 557.5 | $ | 631.0 | ||||
| Acquisitions |
$ | (16.6 | ) | $ | (388.3 | ) | ||
| Capital expenditures |
(158.3 | ) | (206.6 | ) | ||||
| Other |
37.7 | (13.8 | ) | |||||
| Net cash used in investing activities |
$ | (137.2 | ) | $ | (608.7 | ) | ||
| Common share activity |
$ | 9.4 | $ | 20.2 | ||||
| (Payments of) proceeds from debt, net |
(145.8 | ) | 61.7 | |||||
| Dividends |
(85.8 | ) | (82.8 | ) | ||||
| Net cash (used in) provided by financing activities |
$ | (222.2 | ) | $ | (0.9 | ) | ||
| Effect of exchange rate changes on cash |
1.4 | 1.4 | ||||||
| Net increase in cash and cash equivalents |
$ | 199.5 | $ | 22.8 | ||||

| Ø | Sales Growth versus FY 2003 |
| Ø Industrial North America |
2.0% | to | 5.0% | |||
| Ø Industrial ROW |
5.0% | to | 8.0% | |||
| Ø Aerospace |
-8.0% | to | -5.0% | |||
| Ø Climate & Industrial Controls |
-3.0% | to | 0.0% | |||
| Ø Other |
2.0% | to | 5.0% | |||

| Ø | Operating Income change versus FY 2003 |
| Ø Industrial North America |
20.0% | to | 30.0% | |||
| Ø Industrial ROW |
20.0% | to | 30.0% | |||
| Ø Aerospace |
-30.0% | to | -15.0% | |||
| Ø Climate & Industrial Controls |
0.0% | to | 10.0% | |||
| Ø Other |
10.0% | to | 20.0% | |||

| Ø |
Corporate Admin. | + or - | 5% vs. FY 2003
| |||||||||||
| Ø |
Interest Expense | + or - | 5% vs. FY 2003
| |||||||||||
| Ø |
Other | same as FY 2003
| ||||||||||||
| Ø |
Tax Rate | 34.5% | ||||||||||||

| Ø | EPS will be 20% to 30% below 1st quarter of FY 2003 |