
Parker Hannifin Corporation
Quarterly Earnings Release
1st Quarter FY 2004
Exhibit 99.2
October 15, 2003
Parker Hannifin Corporation
Quarterly Earnings Release
1st Quarter FY 2004
Exhibit 99.2
October 15, 2003

Forward Looking Statements
Forward-Looking Statements:
Forward-looking statements
contained in this and other written and oral reports are made based on
known events and circumstances at the time of release, and as such, are subject in the future to unforeseen
uncertainties and risks. All statements regarding future
performance, earnings projections, events or
developments are forward-looking statements. It is possible that the future performance and earnings
projections of the company and individual segments may differ materially from current
expectations,
depending on economic conditions within both its industrial and aerospace markets, and the company’s
ability to achieve anticipated benefits associated with announced realignment activities, strategic
initiatives to
improve operating margins, and growth initiatives. A change in economic conditions in
individual markets may have a particularly volatile effect on segment projections. Among the other
factors which may affect future performance are: changes
in business relationships with and purchases by
or from major customers or suppliers, including delays or cancellations in shipments; uncertainties
surrounding timing, successful completion or integration of acquisitions; threats associated
with and
efforts to combat terrorism; competitive market conditions and resulting effects on sales and pricing;
increases in raw-material costs that cannot be recovered in product pricing; and global economic factors,
including currency
exchange rates, difficulties entering new markets and general economic conditions
such as interest rates. The company makes these statements as of the date of this disclosure, and
undertakes no obligation to update them.

Today’s Agenda
EPS
Acquisition/Divestiture Update
Financial Results
Fiscal Year 2004 Outlook
Questions & Answers

Non-GAAP Financial Measure
This presentation reconciles sales
amounts reported in
accordance with U.S. GAAP to sales amounts adjusted
to remove the effects of acquisitions and divestitures
made within the prior four quarters as well as the
effects of currency exchange rates on
sales. The
effects of acquisitions and divestitures and currency
exchange rates are removed to allow investors and the
company to meaningfully evaluate changes in sales on
a comparable basis from period to
period.
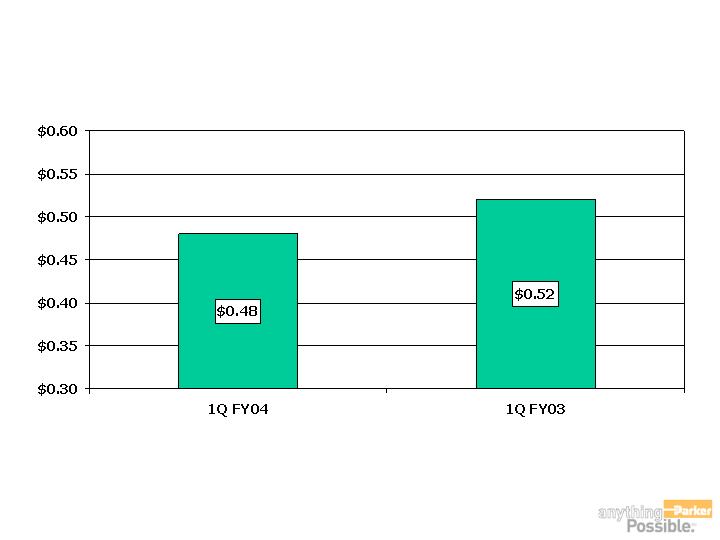
EPS - 1st Quarter

Acquisitions/Divestitures
Name
Date
Sales
Description
N/A this period

Sales – 1st Quarter
FY 2004
FY 2003
Sales
$1,586.9
$1,585.9
% change
0.1%
Sales from acquisitions & divestitures
$5.1
$4.6
Sales without acquisitions & divestitures
$1,581.8
$1,581.3
% change
0.0%
Currency effects
$57.6
Sales without acquisitions, divestitures & currency
$1,524.2
$1,581.3
% change
-3.6%

Income Statement – 1st Quarter
% of Sales
% of Sales
Net sales
$1,586.9
100.0%
$1,585.9
100.0%
Cost of sales
1,298.8
81.8%
1,299.9
82.0%
Gross profit
288.1
18.2%
286.0
18.0%
S, G & A
180.2
11.4%
176.2
11.1%
Goodwill impairment loss
0.0
0.0%
0.0
0.0%
Other income (deductions)
Interest expense
(21.8)
-1.4%
(19.7)
-1.2%
Interest & other income
(1.5)
-0.1%
1.6
0.1%
(23.3)
-1.5%
(18.1)
-1.1%
Income before taxes
84.6
5.3%
91.7
5.8%
Income taxes
27.9
1.8%
30.7
1.9%
Net income
$56.7
3.6%
$61.0
3.8%
FY 2004
FY 2003

Industrial North America
1st Qtr
YTD
1st Qtr
YTD
Sales
As reported
$685.3
$685.3
$727.6
$727.6
% change
-5.8%
-5.8%
Acquisitions
$4.6
$4.6
$0.0
$0.0
without Acquisitions
$680.7
$680.7
$727.6
$727.6
% change
-6.4%
-6.4%
Currency effects
$3.1
$3.1
$0.0
$0.0
without Acquisitions & Currency
$677.6
$677.6
$727.6
$727.6
% change
-6.9%
-6.9%
Operating Margin
$46.6
$46.6
$51.0
$51.0
% of sales
6.8%
6.8%
7.0%
7.0%
FY 2004
FY 2003

Industrial Rest of World
1st Qtr
YTD
1st Qtr
YTD
Sales
As reported
$422.0
$422.0
$365.7
$365.7
% change
15.4%
15.4%
Acquisitions
$0.5
$0.5
$0.0
$0.0
without Acquisitions
$421.5
$421.5
$365.7
$365.7
% change
15.3%
15.3%
Currency effects
$44.5
$44.5
$0.0
$0.0
without Acquisitions & Currency
$377.0
$377.0
$365.7
$365.7
% change
3.1%
3.1%
Operating Margin
$31.3
$31.3
$26.6
$26.6
% of sales
7.4%
7.4%
7.3%
7.3%
FY 2004
FY 2003

Aerospace
1st Qtr
YTD
1st Qtr
YTD
Sales
As reported
$266.8
$266.8
$277.3
$277.3
% change
-3.8%
-3.8%
Acquisitions
$0.0
$0.0
$4.6
$4.6
without Acquisitions
$266.8
$266.8
$272.7
$272.7
% change
-2.2%
-2.2%
Currency effects
$1.4
$1.4
$0.0
$0.0
without Acquisitions & Currency
$265.4
$265.4
$272.7
$272.7
% change
-2.7%
-2.7%
Operating Margin
$33.9
$33.9
$42.5
$42.5
% of sales
12.7%
12.7%
15.3%
15.3%
FY 2004
FY 2003

Climate & Industrial Controls
1st Qtr
YTD
1st Qtr
YTD
Sales
As reported
$156.0
$156.0
$164.7
$164.7
% change
-5.3%
-5.3%
Acquisitions
$0.0
$0.0
$0.0
$0.0
without Acquisitions
$156.0
$156.0
$164.7
$164.7
% change
-5.3%
-5.3%
Currency effects
$2.7
$2.7
$0.0
$0.0
without Acquisitions & Currency
$153.3
$153.3
$164.7
$164.7
% change
-6.9%
-6.9%
Operating Margin
$17.5
$17.5
$15.0
$15.0
% of sales
11.2%
11.2%
9.1%
9.1%
FY 2004
FY 2003

Other
1st Qtr
YTD
1st Qtr
YTD
Sales
As reported
$56.7
$56.7
$50.6
$50.6
% change
12.1%
12.1%
Acquisitions
$0.0
$0.0
$0.0
$0.0
without Acquisitions
$56.7
$56.7
$50.6
$50.6
% change
12.1%
12.1%
Currency effects
$5.9
$5.9
$0.0
$0.0
without Acquisitions & Currency
$50.8
$50.8
$50.6
$50.6
% change
0.4%
0.4%
Operating Margin
$5.7
$5.7
$3.8
$3.8
% of sales
10.1%
10.1%
7.5%
7.5%
FY 2004
FY 2003

Balance
Sheet
Assets
as of September 30
2003
2002
Change
Assets
Current Assets:
Cash and cash equivalents
205.4
45.7
159.7
Accounts receivable, net
967.9
945.9
22.0
Inventories
991.3
1,046.3
(55.0)
Prepaid exepenses
38.9
45.0
(6.1)
Deferred income taxes
102.5
80.4
22.1
Total current assets
2,306.0
2,163.3
142.7
Plant & equipment, net
1,632.5
1,682.0
(49.5)
Goodwill
1,113.6
1,063.9
49.7
Intangible assets, net
57.8
58.5
(0.7)
Other assets
772.7
658.7
114.0
Total assets
5,882.6
5,626.4
256.2
$
$
$
$
$
$
$
$
$

Balance
Sheet
Liabilities & Shareholders’ Equity
as of September 30
2003
2002
Change
Liabilities and shareholders' equity
Current liabilities:
Notes payable
289.0
453.1
(164.1)
Accounts payable
415.4
413.9
1.5
Accrued liabilities
466.5
418.7
47.8
Accrued domestic and foreign taxes
85.5
51.4
34.1
Total current liabilities
1,256.4
1,337.1
(80.7)
Long-term debt
956.4
955.3
1.1
Pension and other postretirement benefits
922.7
502.3
420.4
Deferred income taxes
16.9
89.6
(72.7)
Other liabilities
142.3
128.9
13.4
Shareholders' equity
2,587.9
2,613.2
(25.3)
Total liabilities and shareholders' equity
$5,882.6
$5,626.4
$ 256.2
$
$
$
$
$
$

Statement of Cash Flows
for the quarters ended September 30
2003
2002
Net income
56.7
61.0
Depreciation & amortization
63.4
64.1
Net change in receivables, inventory & payables
26.5
26.8
Net change in other assets & liabilities
3.0
(22.3)
Other, net
(5.6)
15.6
Net cash provided by operating activities
144.0
145.2
Acquisitions
-
(2.0)
Capital expenditures
(36.8)
(38.6)
Other
5.2
4.9
Net cash used in investing activities
(31.6)
(35.7)
Common share activity
13.7
0.8
(Payments of) proceeds from debt, net
(145.6)
(90.2)
Dividends
(22.1)
(20.8)
Net cash (used in) provided by financing activities
(154.0)
(110.2)
Effect of exchange rate changes on cash
1.2
0.1
Net increase in cash and cash equivalents
$ (40.4)
$ (0.6)
$
$
$
$
$
$
$
$
$
$
$
$
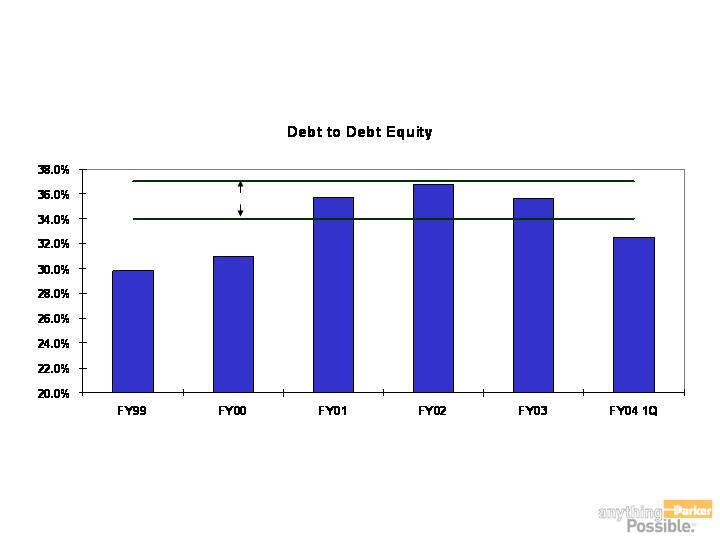
Financial Leverage
Target
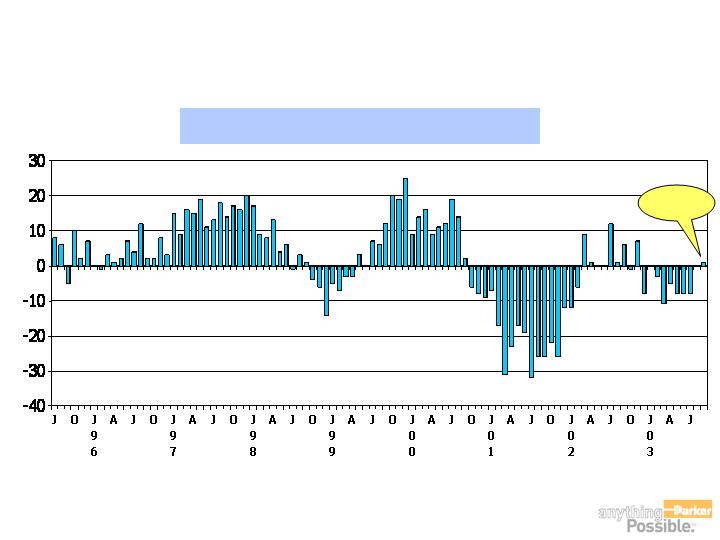
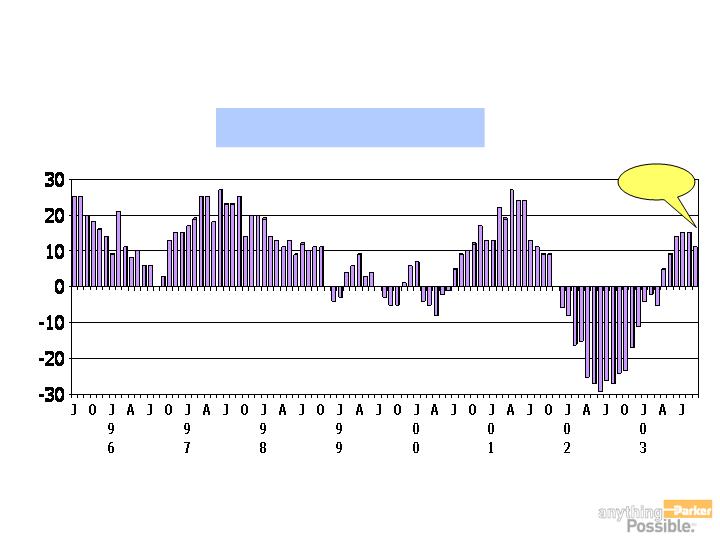
Industrial North America
Current month vs. prior year
+1
Parker New Order Rates
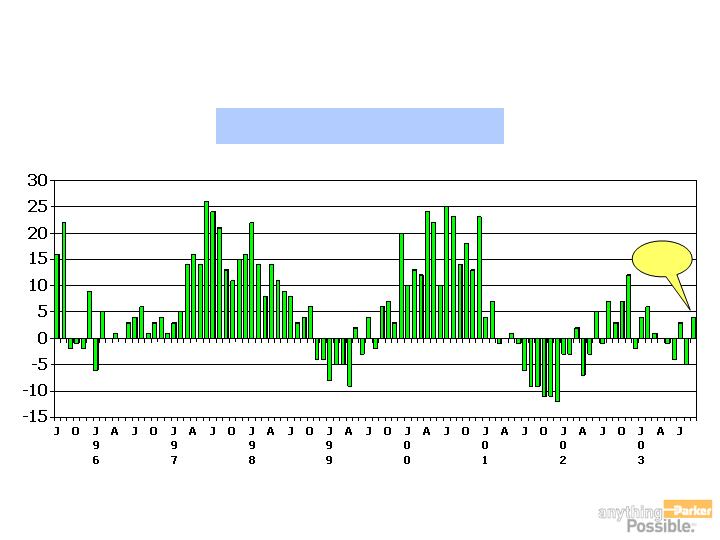
Industrial R.O.W.
Current month vs. prior year
+4
Parker New Order Rates
Aerospace
Average last 12 months orders to previous 12 months orders
+11
Parker New Order Rates
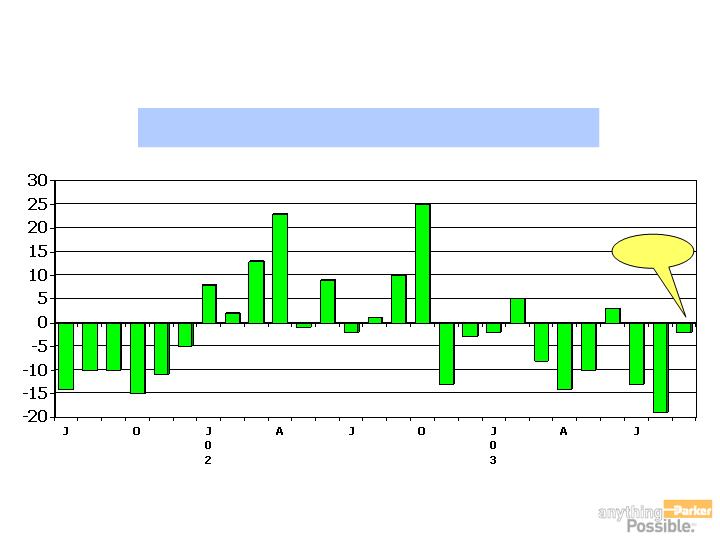
Climate & Industrial Control
Current month vs. prior year
-2
Parker New Order Rates

FY 2004
Outlook
Business Segment
Sales Growth versus FY 2003
Industrial North America
2.0%
to
5.0%
Industrial ROW
5.0%
to
8.0%
Aerospace
-8.0%
to
-5.0%
Climate & Industrial Controls
-3.0%
to
0.0%
Other
2.0%
to
5.0%

FY 2004
Outlook
Business Segment
Operating Income change versus FY 2003
Industrial North America
20.0%
to
30.0%
Industrial ROW
20.0%
to
30.0%
Aerospace
-30.0%
to
-15.0%
Climate & Industrial Controls
0.0%
to
10.0%
Other
10.0%
to
20.0%

FY 2004
Outlook
Business Segment
Corporate Admin.
+ 5% to 10%
vs. FY 2003
Interest Expense
+ or -
5%
vs. FY 2003
Other Expense (Income)
same as FY 2003
Tax Rate
33.0%

Questions & Answers...