
Exhibit 99.2
Parker Hannifin Corporation Quarterly Earnings Release 3rd Quarter FY 2004 April 19, 2004
Forward Looking Statements
The company makes these statements as of the date of this disclosure, and Forward-Looking Statements: Forward-looking statements contained in this and other written and oral reports are made based on known events and circumstances at the time of release, and as such, are subject in the future to unforeseen uncertainties and risks. All statements regarding future performance, earnings projections, events or developments are forward-looking statements. It is possible that the future performance and earnings projections of the company and individual segments may differ materially from current expectations, depending on economic conditions within both its industrial and aerospace markets, and the company’s ability to achieve anticipated benefits associated with announced realignment activities, strategic initiatives to improve operating margins, and growth initiatives. A change in economic conditions in individual markets may have a particularly volatile effect on segment results. Among the other factors which may affect future performance are: changes in business relationships with and purchases by or from major customers or suppliers, including delays or cancellations in shipments; uncertainties surrounding timing, successful completion or integration of acquisitions; threats associated with and efforts to combat terrorism; competitive market conditions and resulting effects on sales and pricing; increases in raw-material costs that cannot be recovered in product pricing; and global economic factors, including currency exchange rates, difficulties entering new markets and general economic conditions such as interest rates. undertakes no obligation to update them.
Non-GAAP Financial Measure
This presentation reconciles sales amounts reported in to remove the effects of acquisitions and divestitures made within the prior four quarters as well as the The accordance with U.S. GAAP to sales amounts adjusted effects of currency exchange rates on sales. effects of acquisitions and divestitures and currency exchange rates are removed to allow investors and the company to meaningfully evaluate changes in sales on a comparable basis from period to period.

Discussion Agenda
Financial Highlights Influences on Sales & Earnings WIN Strategy Balance Sheet & Cash Flow Trends Outlook Questions & Answers
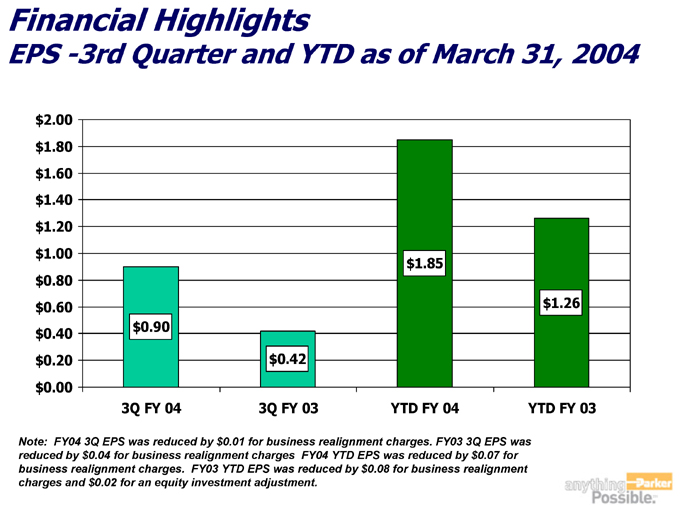
Financial HighlightsEPS -3rd Quarter and YTD as of March 31, 2004
$1.26 YTD FY 03 $1.85 YTD FY 04 $0.42 3Q FY 03
$0.90 3Q FY 04 $2.00 $1.80 $1.60 $1.40 $1.20 $1.00 $0.80 $0.60 $0.40 $0.20 $0.00
charges. FY03 3Q EPS was FY04 YTD EPS was reduced by $0.07 for for business realignment FY04 3Q EPS was reduced by $0.01 for business realignment FY03 YTD EPS was reduced by $0.08 Note: reduced by $0.04 for business realignment charges business realignment charges. charges and $0.02 for an equity investment adjustment.
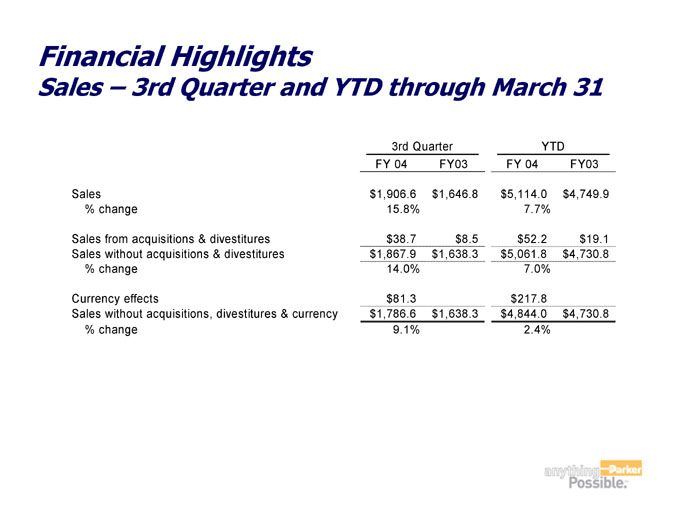
3rd Quarter and YTD through March 31
Financial HighlightsSales –
FY03 $4,749.9 $19.1 $4,730.8 $4,730.8 YTD
FY 04 $5,114.0 7.7% $52.2 $5,061.8 7.0% $217.8 $4,844.0 2.4% FY03 $1,646.8 $8.5 $1,638.3 $1,638.3 3rd Quarter FY 04 $1,906.6 15.8% $38.7 $1,867.9 14.0% $81.3 $1,786.6 9.1% Sales % change Sales from acquisitions & divestitures Sales without acquisitions & divestitures % change Currency effects Sales without acquisitions, divestitures & currency % change
Significant Influences on Sales
Commercial Military
Industrial end market strength/weakness Aerospace Globalization Trends
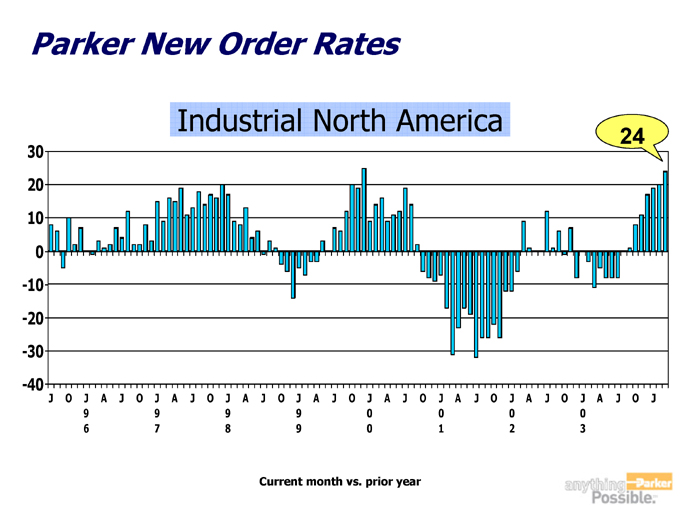
Parker New Order Rates
Industrial North America
24
J
O J
A
J 0 3
O J
A
J 0 2
O J
A
J 0 1
O J
A
J 0 0
O J
A
J 9 9
O J
A
J 9 8
O J
A
J 9 7
O J
A
J 9 6
O J
30 20 10 0 -10 -20 -30 -40
Current month vs. prior year
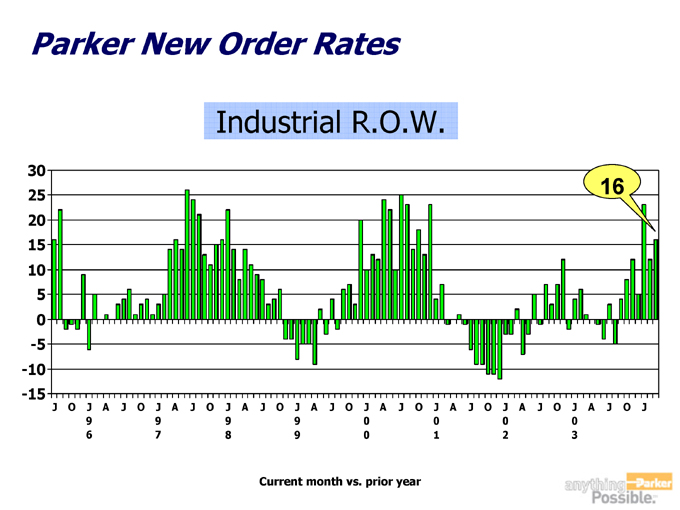
Parker New Order Rates
Industrial R.O.W.
J
O
16 J
A J 0 3 O J A J 0 2 O J A J 0 1 O J A J 0 0 O J A J 9 9 O J A J 9 8
O J A J 9 7 O J A J 9 6 O J
30 25 20 15 10 5 0 -5 -10 -15
Current month vs. prior year
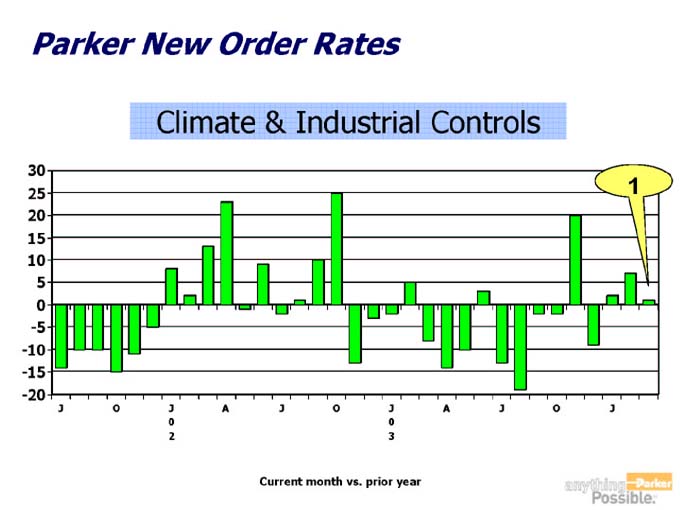
Parker New Order Rates
Climate & Industrials
Current month vs. prior year
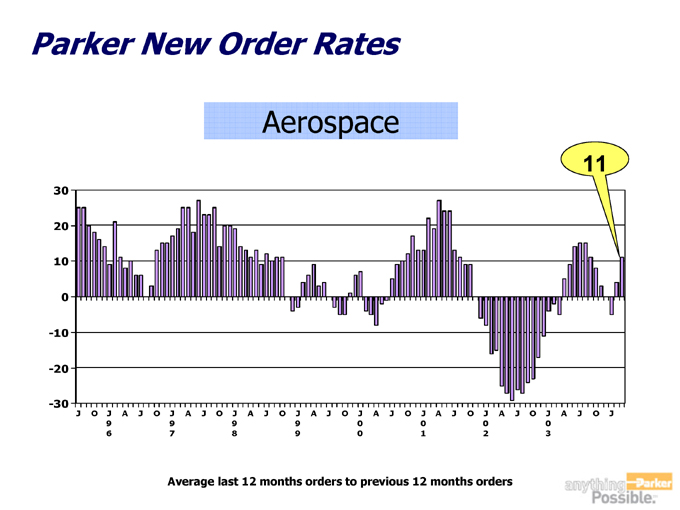
Parker New Order Rates
Aerospace
J
11 O
J A J 0 3 O J A J 0 2 O J A J 0 1 O J A J 0 0 O J A J 9 9 O J A J 9 8 O J A J 9 7 O J A J 9 6 O J
30 20 10 0 -10 -20 -30
Average last 12 months orders to previous 12 months orders
Influences on Earnings
Win Strategy Impact Aerospace/CIC Increased Volume Restructuring Sales Mix –
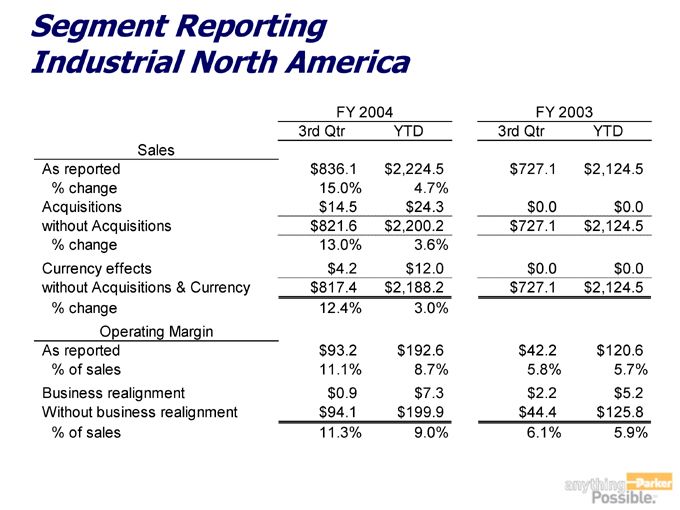
Segment ReportingIndustrial North America
$0.0 $0.0 $120.6 5.7% $5.2 $125.8 5.9% YTD $2,124.5 $2,124.5 $2,124.5 FY 2003 $0.0 $0.0 $42.2 5.8% $2.2 $44.4 6.1% 3rd Qtr $727.1 $727.1 $727.1 4.7% $24.3 3.6% $12.0 3.0% $192.6 8.7% $7.3 $199.9 9.0% YTD $2,224.5 $2,200.2 $2,188.2 FY 2004 15.0% $14.5 13.0% $4.2 12.4% $93.2 11.1% $0.9 $94.1 11.3% 3rd Qtr $836.1 $821.6 $817.4
Sales Operating Margin
As reported % change Acquisitions without Acquisitions % change Currency effects without Acquisitions & Currency % change As reported % of sales Business realignment Without business realignment % of sales
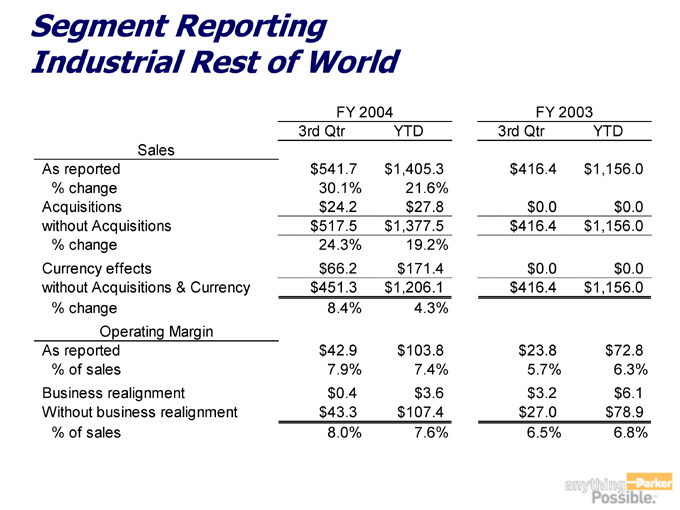
Segment ReportingIndustrial Rest of World
$0.0 $0.0 $72.8 6.3% $6.1 $78.9 6.8% YTD $1,156.0 $1,156.0 $1,156.0 FY 2003 $0.0 $0.0 $23.8 5.7% $3.2 $27.0 6.5% 3rd Qtr $416.4 $416.4 $416.4 21.6% $27.8 19.2% $171.4 4.3% $103.8 7.4% $3.6 $107.4 7.6% YTD $1,405.3 $1,377.5 $1,206.1 FY 2004 30.1% $24.2 24.3% $66.2 8.4% $42.9 7.9% $0.4 $43.3 8.0% 3rd Qtr $541.7 $517.5 $451.3
Sales Operating Margin
As reported % change Acquisitions without Acquisitions % change Currency effects without Acquisitions & Currency % change As reported % of sales Business realignment Without business realignment % of sales
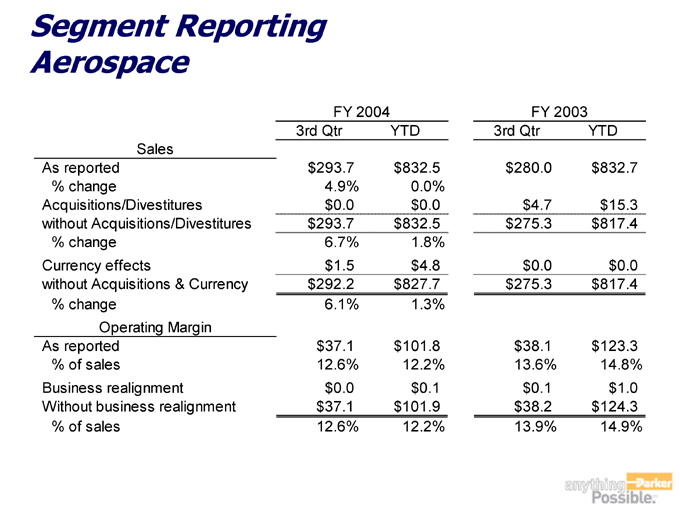
Segment ReportingAerospace
$832.7 $15.3 $817.4 $0.0 $817.4 $123.3 14.8% $1.0 $124.3 14.9% YTD
FY 2003 $4.7 $0.0 $38.1 13.6% $0.1 $38.2 13.9% 3rd Qtr $280.0 $275.3 $275.3 $832.5 0.0% $0.0 $832.5 1.8% $4.8 $827.7 1.3% $101.8 12.2% $0.1 $101.9 12.2% YTD
FY 2004 4.9% $0.0 6.7% $1.5 6.1% $37.1 12.6% $0.0 $37.1 12.6% 3rd Qtr $293.7 $293.7 $292.2
Sales Operating Margin
As reported % change Acquisitions/Divestitures without Acquisitions/Divestitures % change Currency effects without Acquisitions & Currency % change As reported % of sales Business realignment Without business realignment % of sales
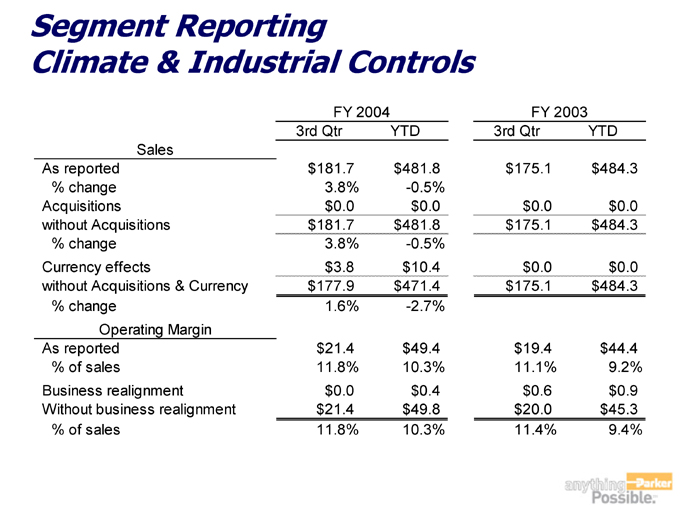
Segment ReportingClimate & Industrial Controls
$484.3 $0.0 $484.3 $0.0 $484.3 $44.4 9.2% $0.9 $45.3 9.4% YTD
FY 2003 $0.0 $0.0 $19.4 11.1% $0.6 $20.0 11.4% 3rd Qtr $175.1 $175.1 $175.1 $481.8 -0.5% $0.0 $481.8 -0.5% $10.4 $471.4 -2.7% $49.4 10.3% $0.4 $49.8 10.3% YTD
FY 2004 3.8% $0.0 3.8% $3.8 1.6% $21.4 11.8% $0.0 $21.4 11.8% 3rd Qtr $181.7 $181.7 $177.9
Sales Operating Margin
As reported % change Acquisitions without Acquisitions % change Currency effects without Acquisitions & Currency % change As reported % of sales Business realignment Without business realignment % of sales
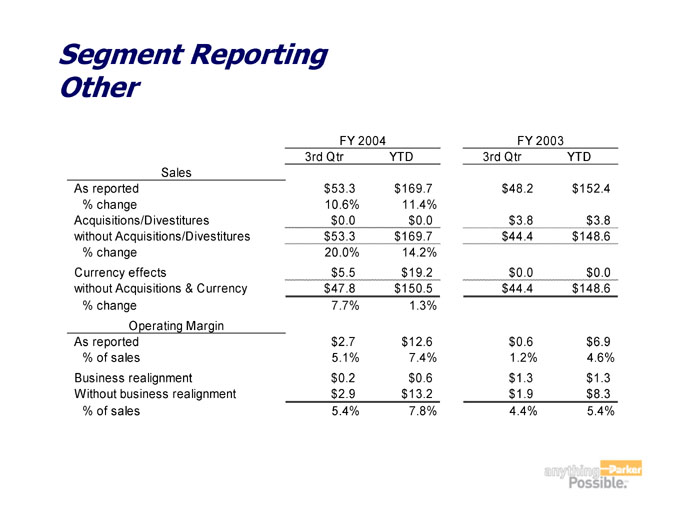
Segment ReportingOther
$152.4 $3.8 $148.6 $0.0 $148.6 $6.9 4.6% $1.3 $8.3 5.4% YTD
FY 2003 $48.2 $3.8 $44.4 $0.0 $44.4 $0.6 1.2% $1.3 $1.9 4.4% 3rd Qtr $169.7 11.4% $0.0 $169.7 14.2% $19.2 $150.5 1.3% $12.6 7.4% $0.6 $13.2 7.8% YTD
FY 2004 $53.3 10.6% $0.0 $53.3 20.0% $5.5 $47.8 7.7% $2.7 5.1% $0.2 $2.9 5.4% 3rd Qtr
Sales Operating Margin
As reported % change Acquisitions/Divestitures without Acquisitions/Divestitures % change Currency effects without Acquisitions & Currency % change As reported % of sales Business realignment Without business realignment % of sales

Balance Sheet Summary
Inventory
Cash Working Capital P, P & E Shareholders Equity
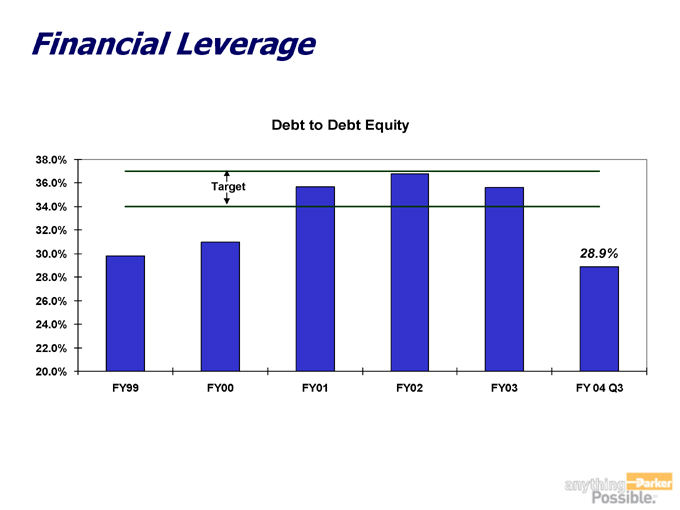
Financial Leverage
Debt to Debt Equity
28.9% FY 04 Q3 FY03
FY02
FY01
Target FY00 FY99 38.0% 36.0% 34.0% 32.0% 30.0% 28.0% 26.0% 24.0% 22.0% 20.0%
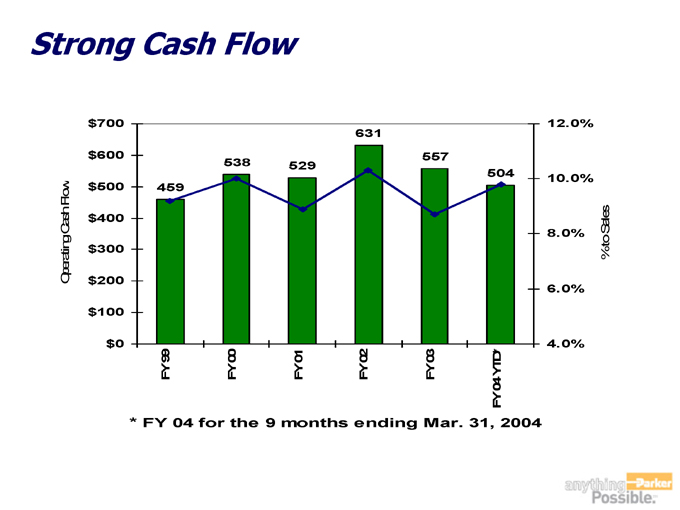
Strong Cash Flow
Sales % to
12.0% 10.0% 8.0% 6.0% 4.0%
504 YTD* 04 FY
557 03 FY
631 02 FY
529 01 FY
538 00 FY
459 99 FY FY 04 for the 9 months ending Mar. 31, 2004
*
$700 $600 $500 $400 $300 $200 $100 $0
Flow Cash Operating
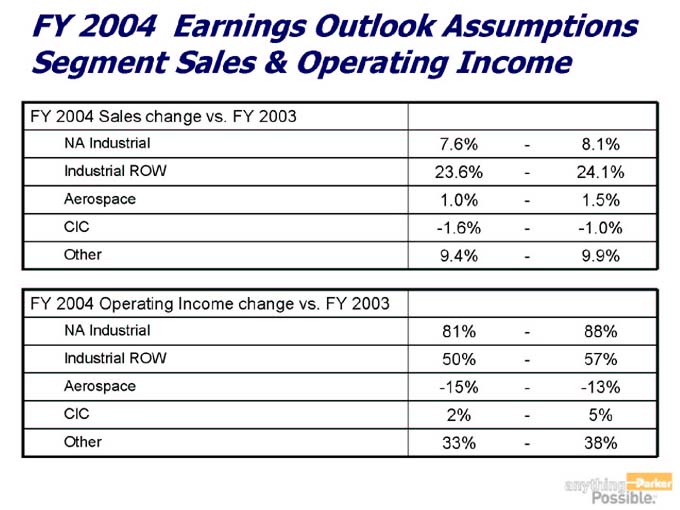
Earnings Outlook Assumptions Segment Sales & Operating Margins FY 2004
8.1% 24.1% 1.5% -1.0% 9.9% 88% 57% -13% 5% 38%
7.6% 23.6% 1.0% -1.6% 9.4% 81% 50% -15% 2% 33% FY 2004 Sales change vs. FY 2003 NA Industrial Industrial ROW Aerospace CIC Other FY 2004 Operating Margin change vs. FY 2003 NA Industrial Industrial ROW Aerospace CIC Other
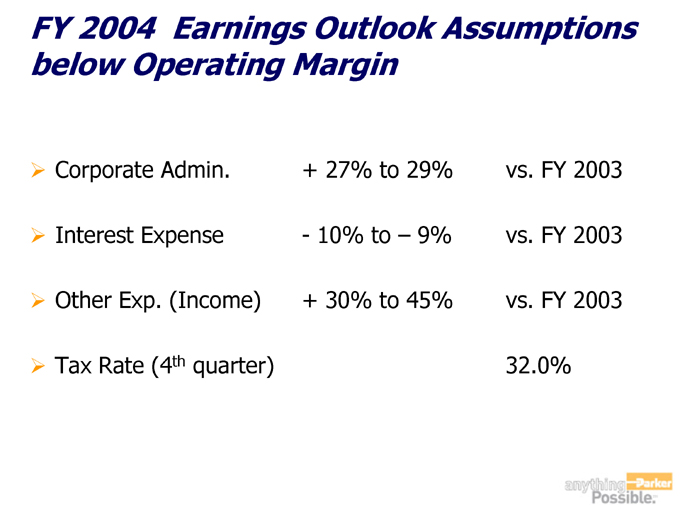
Earnings Outlook Assumptions FY 2004below Operating Margin
vs. FY 2003 vs. FY 2003 vs. FY 2003 32.0% 9% + 27% to 29% 10% to –
- + 30% to 45% quarter) th
Corporate Admin. Interest Expense Other Exp. (Income) Tax Rate (4
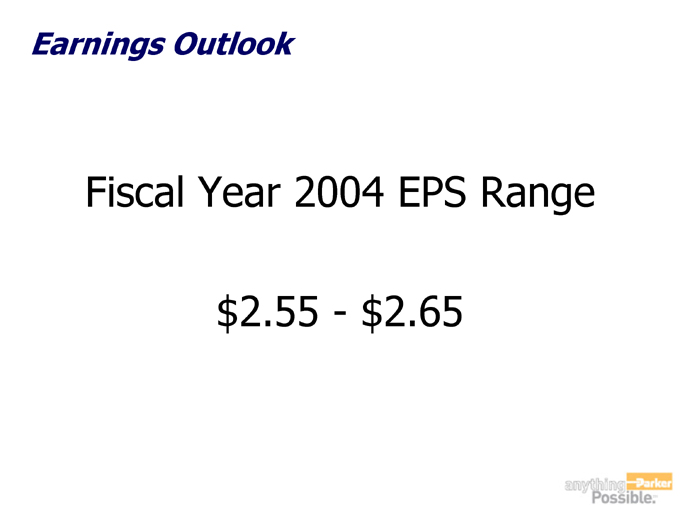
Earnings Outlook
$2.65 Fiscal Year 2004 EPS Range $2.55 -
Forecast Risks
Raw material price increases Automotive
Downside:
Aerospace recovery
Upside:

Questions & Answers
Appendix
FY 2004 Income Statements
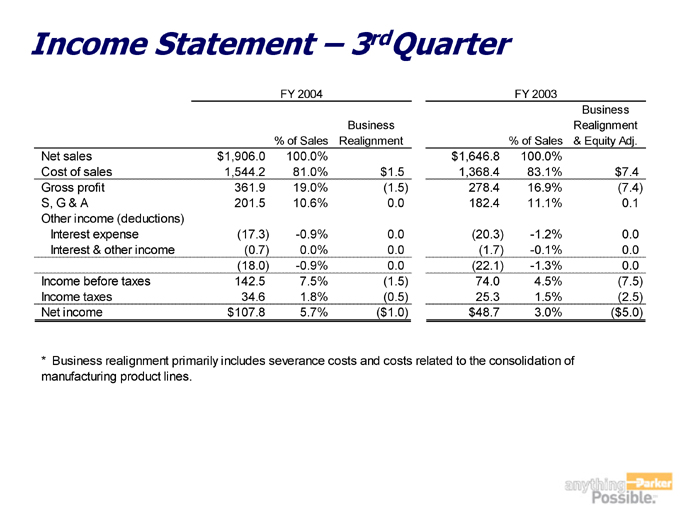
Quarter 3 rd
Income Statement –
$7.4 (7.4) 0.1 0.0 0.0 0.0 (7.5) (2.5) ($5.0)
Business Realignment & Equity Adj.
FY 2003 % of Sales 100.0% 83.1% 16.9% 11.1% -1.2% -0.1% -1.3% 4.5% 1.5% 3.0% $1,646.8 1,368.4 278.4 182.4 (20.3) (1.7) (22.1) 74.0 25.3 $48.7 Business Realignment $1.5 (1.5) 0.0 0.0 0.0 0.0 (1.5) (0.5) ($1.0) FY 2004 % of Sales 100.0% 81.0% 19.0% 10.6% -0.9% 0.0% -0.9% 7.5% 1.8% 5.7% $1,906.0 1,544.2 361.9 201.5 (17.3) (0.7) (18.0) 142.5 34.6 $107.8 Net sales Cost of sales Gross profit S, G & A Other income (deductions) Interest expense Interest & other income Income before taxes Income taxes Net income
Business realignment primarily includes severance costs and costs related to the consolidation of manufacturing product lines. *
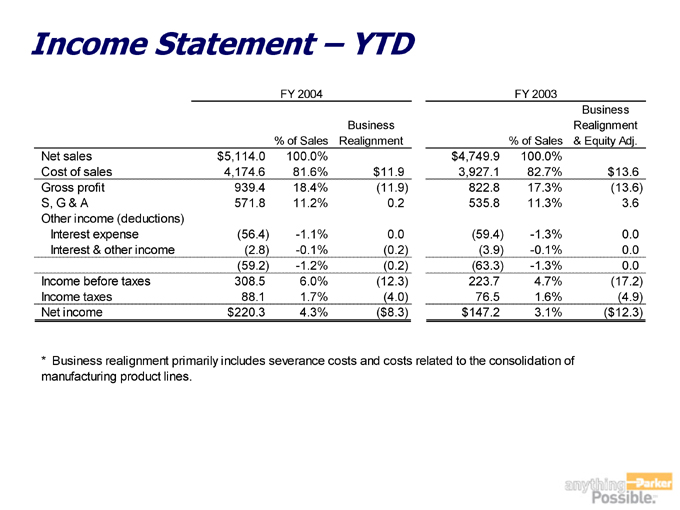
YTD Income Statement –
$13.6 (13.6) 3.6 0.0 0.0 0.0 (17.2) (4.9) ($12.3)
Business Realignment & Equity Adj.
FY 2003 % of Sales 100.0% 82.7% 17.3% 11.3% -1.3% -0.1% -1.3% 4.7% 1.6% 3.1% $4,749.9 3,927.1 822.8 535.8 (59.4) (3.9) (63.3) 223.7 76.5 $147.2 Business Realignment $11.9 (11.9) 0.2 0.0 (0.2) (0.2) (12.3) (4.0) ($8.3) FY 2004 % of Sales 100.0% 81.6% 18.4% 11.2% -1.1% -0.1% -1.2% 6.0% 1.7% 4.3% $5,114.0 4,174.6 939.4 571.8 (56.4) (2.8) (59.2) 308.5 88.1 $220.3 Net sales Cost of sales Gross profit S, G & A Other income (deductions) Interest expense Interest & other income Income before taxes Income taxes Net income
Business realignment primarily includes severance costs and costs related to the consolidation of manufacturing product lines. *