
Exhibit 99.2
Parker Hannifin Corporation
Quarterly Earnings Release 1st Quarter FY 2005
October 19, 2004
Forward Looking Statements
Forward-Looking Statements:
Forward-looking statements contained in this and other written and oral reports are made based on known events and circumstances at the time of release, and as such, are subject in the future to unforeseen uncertainties and risks. All statements regarding future performance, earnings projections, events or developments are forward-looking statements. It is possible that the future performance and earnings projections of the company and individual segments may differ materially from current expectations, depending on economic conditions within both its industrial and aerospace markets, and the company’s ability to achieve anticipated benefits associated with announced realignment activities, strategic initiatives to improve operating margins, and growth initiatives. A change in economic conditions in individual markets may have a particularly volatile effect on segment projections. Among the other factors which may affect future performance are: changes in business relationships with and purchases by or from major customers or suppliers, including delays or cancellations in shipments; uncertainties surrounding timing, successful completion or integration of acquisitions; threats associated with and efforts to combat terrorism; competitive market conditions and resulting effects on sales and pricing; increases in raw-material costs that cannot be recovered in product pricing; and global economic factors, including currency exchange rates, difficulties entering new markets and general economic conditions such as inflation and interest rates. The company makes these statements as of the date of this disclosure, and undertakes no obligation to update them.
Non-GAAP Financial Measure
This presentation reconciles sales amounts reported in accordance with U.S. GAAP to sales amounts adjusted to remove the effects of acquisitions and divestitures made within the prior four quarters as well as the effects of currency exchange rates on sales. The effects of acquisitions and divestitures and currency exchange rates are removed to allow investors and the company to meaningfully evaluate changes in sales on a comparable basis from period to period.

Discussion Agenda
Financial Highlights
Influences on Sales & Earnings WIN Strategy Balance Sheet & Cash Flow Trends Outlook Questions & Answers
Financial Highlights
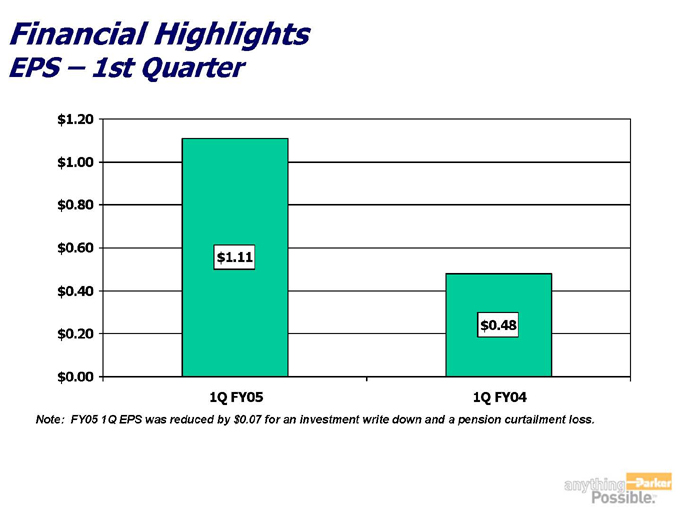
EPS – 1st Quarter
$1.20
$1.00
$0.80
$0.60
$0.40
$0.20
$0.00
$1.11
$0.48
1Q FY05
1Q FY04
Note: FY05 1Q EPS was reduced by $0.07 for an investment write down and a pension curtailment loss.
Financial Highlights
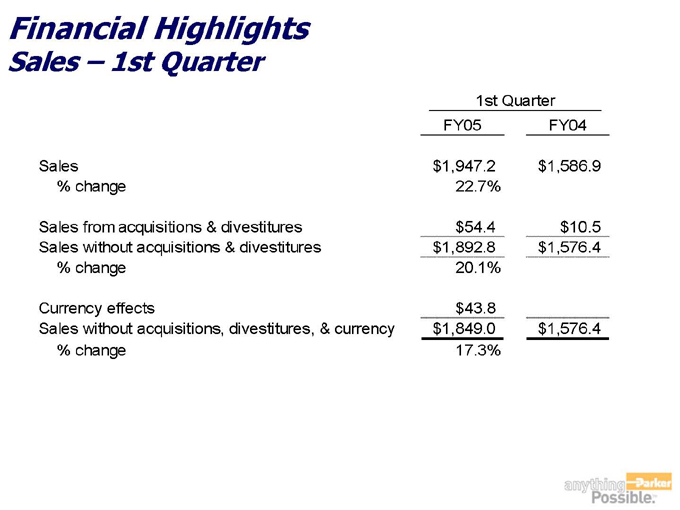
Sales – 1st Quarter
1st Quarter
FY05 FY04
Sales $1,947.2 $1,586.9
% change 22.7%
Sales from acquisitions & divestitures $54.4 $10.5
Sales without acquisitions & divestitures $1,892.8 $1,576.4
% change 20.1%
Currency effects $43.8
Sales without acquisitions, divestitures, & currency $1,849.0 $1,576.4
% change 17.3%
Significant Influences on Sales
Continued Industrial End Market Strength
Aerospace
Commercial
Defense
Globalization Trends
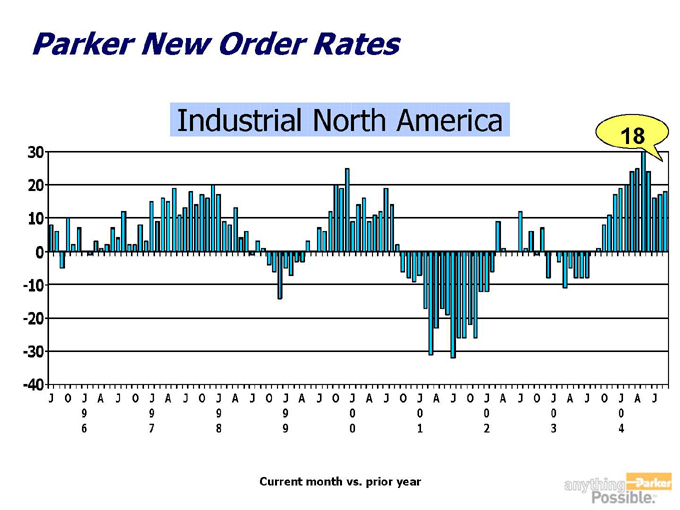
Parker New Order Rates
Industrial North America
18
30
20
10
0
-10
-20
-30
-40
J O J A J O J A J O J A J O J A J O J A J O J A J O J A J O J A J O J A J
9 9 9 9 0 0 0 0 0
6 7 8 9 0 1 2 3 4
Current month vs. prior year

Parker New Order Rates
Industrial R.O.W.
30
25
20
15
10
5
0
-5
-10
-15
12
J O J A J O J A J O J A J O J A J O J A J O J A J O J A J O J A J O J A J
9 9 9 9 0 0 0 0 0
6 7 8 9 0 1 2 3 4
Current month vs. prior year
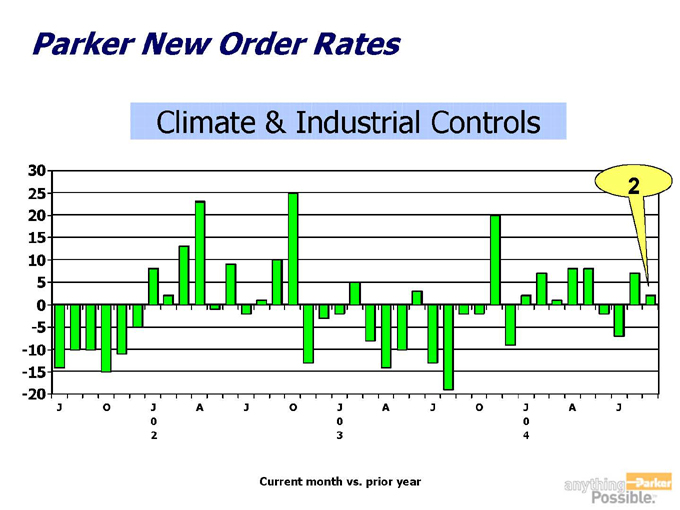
Parker New Order Rates
Climate & Industrial Controls
30
25
20
15
10
5
0
-5
-10
-15
-20
2
J O J A J O J A J O J A J
0 0 0
2 3 4
Current month vs. prior year
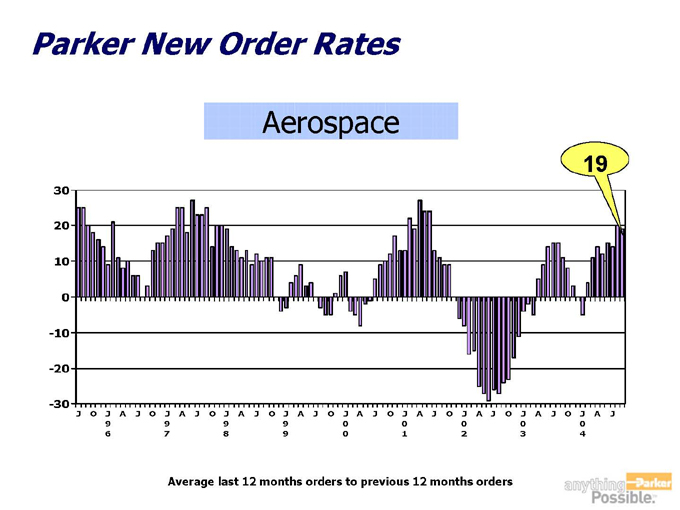
Parker New Order Rates
Aerospace
19
30
20
10
0
-10
-20
-30
J O J A J O J A J O J A J O J A J O J A J O J A J O J A J O J A J O J A J
9 9 9 9 0 0 0 0 0
6 7 8 9 0 1 2 3 4
Average last 12 months orders to previous 12 months orders
Influences on Earnings
Increased Volume
Win Strategy
Restructuring/Move to Low Cost Countries Sales Mix – Aerospace Pension Curtailment Loss & Investment Write Off
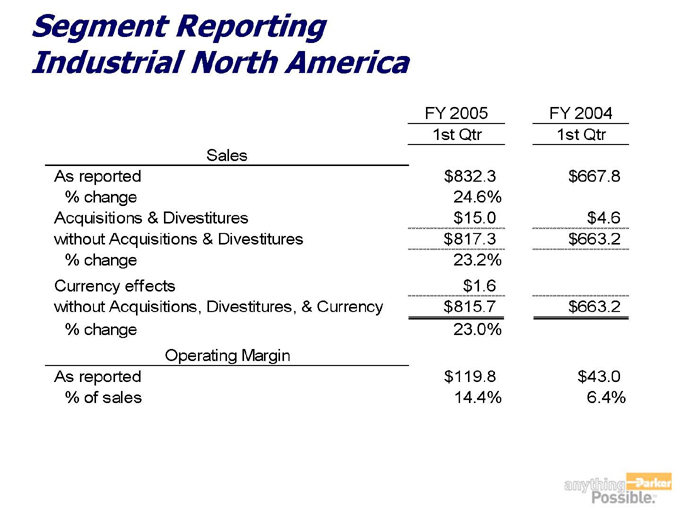
Segment Reporting Industrial North America
FY 2005 1st Qtr FY 2004 1st Qtr
Sales
As reported $832.3 $667.8
% change 24.6%
Acquisitions & Divestitures $15.0 $4.6
without Acquisitions & Divestitures $817.3 $663.2
% change 23.2%
Currency effects $1.6
without Acquisitions, Divestitures, & Currency $815.7 $663.2
% change 23.0%
Operating Margin
As reported $119.8 $43.0
% of sales 14.4% 6.4%
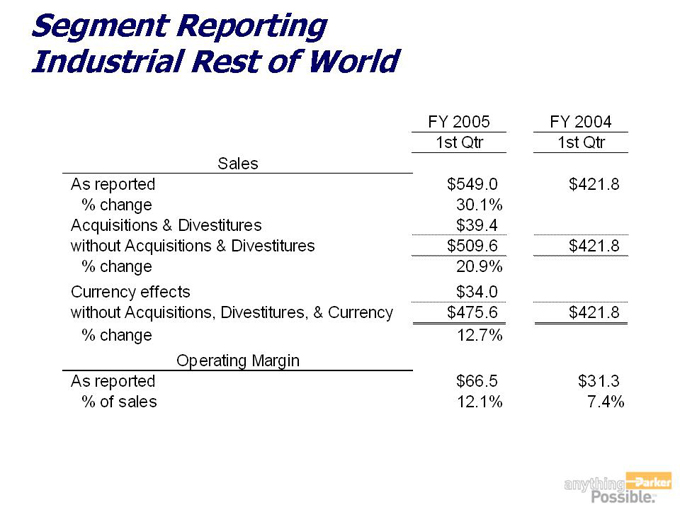
Segment Reporting Industrial Rest of World
FY 2005 1st Qtr FY 2004 1st Qtr
Sales
As reported $549.0 $421.8
% change 30.1%
Acquisitions & Divestitures $39.4
without Acquisitions & Divestitures $509.6 $421.8
% change 20.9%
Currency effects $34.0
without Acquisitions, Divestitures, & Currency $475.6 $421.8
% change 12.7%
Operating Margin
As reported $66.5 $31.3
% of sales 12.1% 7.4%

Segment Reporting Aerospace
FY 2005 1st Qtr FY 2004 1st Qtr
Sales
As reported $331.1 $284.6
% change 16.3%
Acquisitions & Divestitures
without Acquisitions & Divestitures $331.1 $284.6
% change 16.3%
Currency effects $1.5
without Acquisitions, Divestitures, & Currency $329.6 $284.6
% change 15.8%
Operating Margin
As reported $51.3 $37.5
% of sales 15.5% 13.2%

Segment Reporting Climate & Industrial Controls
FY 2005 1st Qtr FY 2004 1st Qtr
Sales
As reported $165.5 $156.0
% change 6.1%
Acquisitions & Divestitures
without Acquisitions & Divestitures $165.5 $156.0
% change 6.1%
Currency effects $2.1
without Acquisitions, Divestitures & Currency $163.4 $156.0
% change 4.8%
Operating Margin
As reported $15.8 $17.5
% of sales 9.6% 11.2%
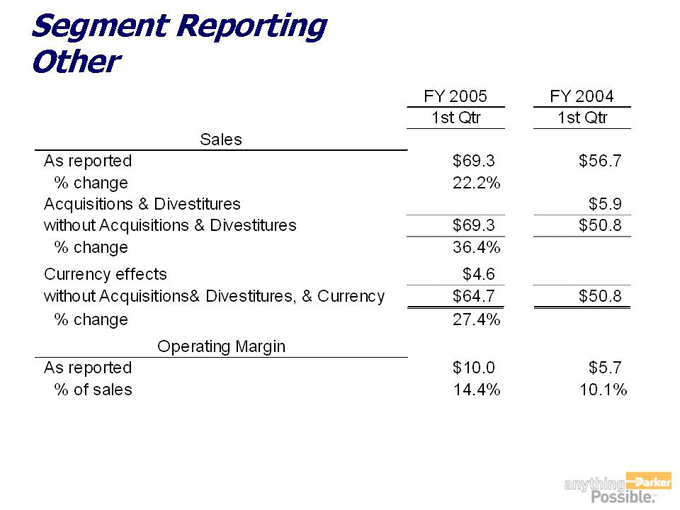
Segment Reporting Other
FY 2005 FY 2004
1st Qtr 1st Qtr
Sales
As reported $69.3 $56.7
% change 22.2%
Acquisitions & Divestitures $5.9
without Acquisitions & Divestitures $69.3 $50.8
% change 36.4%
Currency effects $4.6
without Acquisitions& Divestitures, & Currency $64.7 $50.8
% change 27.2%
Operating Margin
As reported $10.0 $5.7
% of sales 14.4% 10.1%
Balance Sheet Summary
Cash
Working Capital
Inventory
Accounts Receivable
PP & E
Shareholders Equity
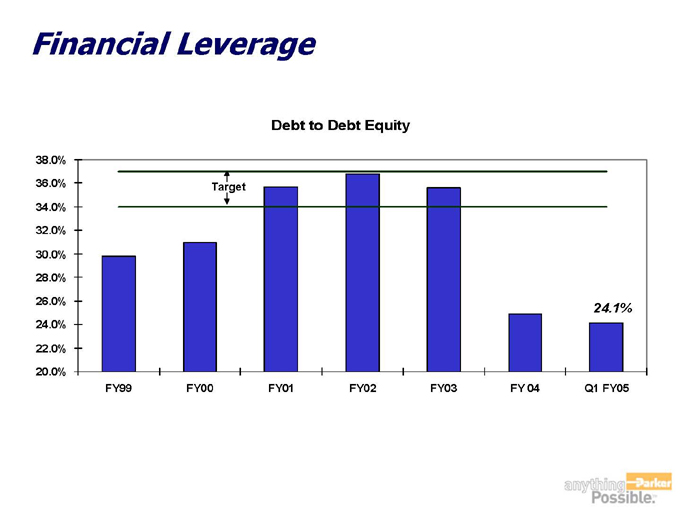
Financial Leverage
Debt to Debt Equity
38.0%
36.0%
34.0%
32.0%
30.0%
28.0%
26.0%
24.0%
22.0%
20.0%
Target
24.1%
FY99 FY00 FY01 FY02 FY03 FY 04 Q1 FY05
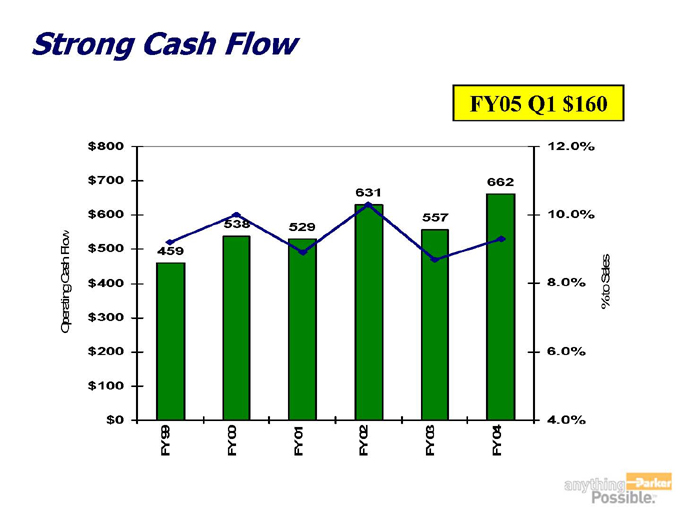
Strong Cash Flow
FY05 Q1 $160
Operating Cash Flow
$800
$700
$600
$500
$400
$300
$200
$100
$0
459 538 529 631 557 662
12.0%
10.0%
8.0% Sales% to
6.0%
4.0%
FY 99 FY 00 FY 01 FY 02 FY 03 FY 04
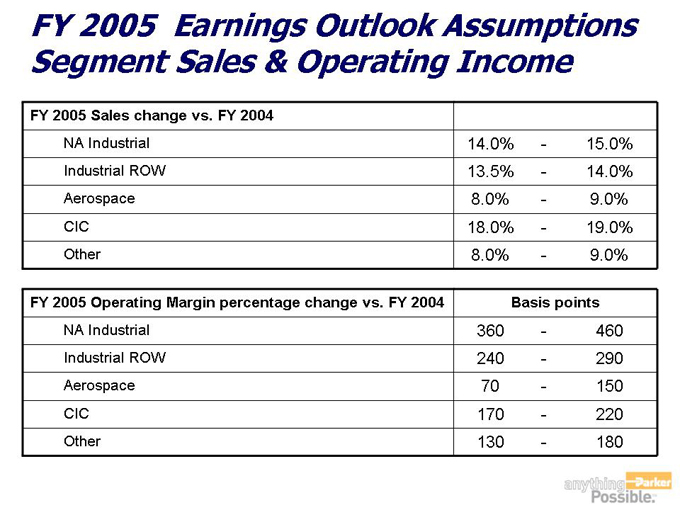
FY 2005 Earnings Outlook Assumptions Segment Sales & Operating Income
FY 2005 Sales change vs. FY 2004
NA Industrial 14.0% - 15.0%
Industrial ROW 13.5% - 14.0%
Aerospace 8.0% - 9.0%
CIC 18.0% - 19.0%
Other 8.0% - 9.0%
FY 2005 Operating Margin percentage change vs. FY 2004 Basis points
NA Industrial 360 - 460
Industrial ROW 240 - 290
Aerospace 70 - 150
CIC 170 - 220
Other 130 - 180
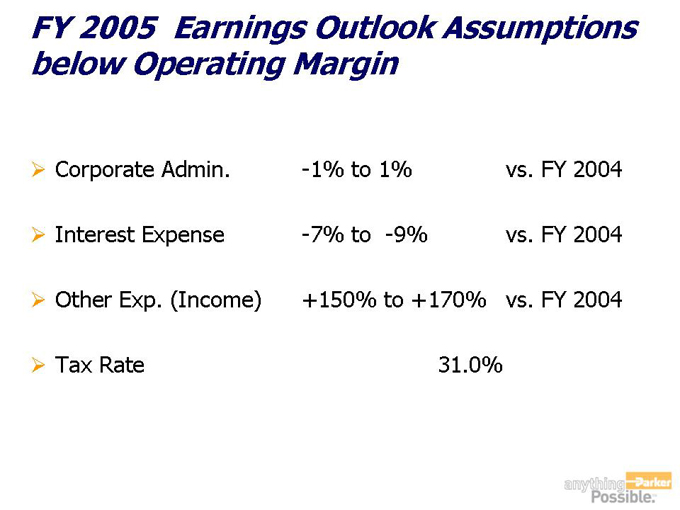
FY 2005 Earnings Outlook Assumptions below Operating Margin
Corporate Admin. -1% to 1% vs. FY 2004
Interest Expense -7% to -9% vs. FY 2004
Other Exp. (Income) +150% to +170% vs. FY 2004
Tax Rate 31.0%
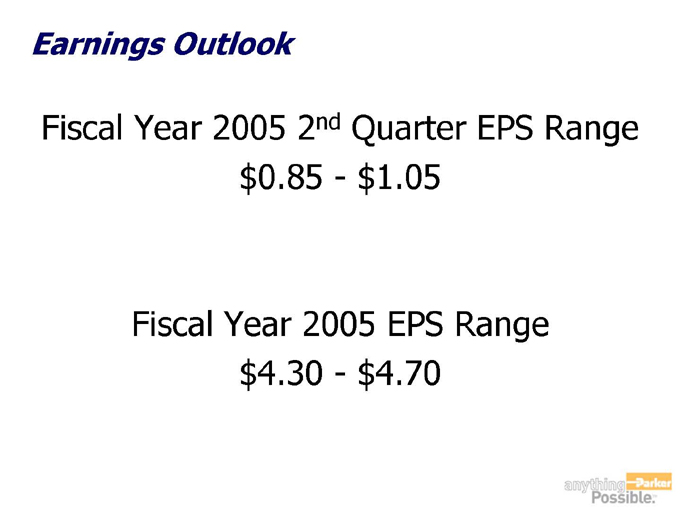
Earnings Outlook
Fiscal Year 2005 2nd Quarter EPS Range $0.85 - $1.05
Fiscal Year 2005 EPS Range $4.30 - $4.70
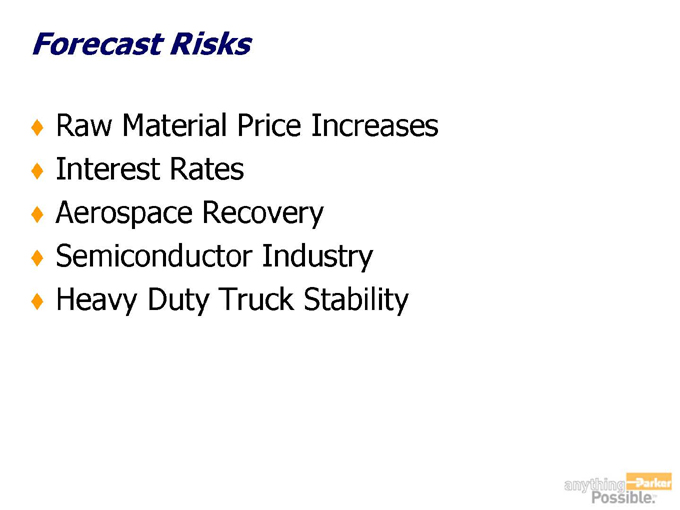
Forecast Risks
Raw Material Price Increases Interest Rates Aerospace Recovery Semiconductor Industry Heavy Duty Truck Stability

Questions & Answers
anything Possible

Appendix
FY 2005 1st Quarter Income Statement
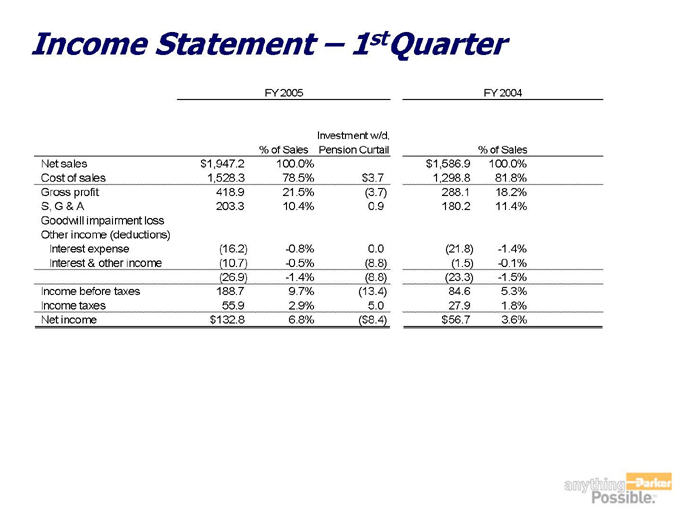
Income Statement – 1stQuarter
FY 2005 FY 2004
% of Sales Investment w/d, Pension Curtail % of Sales
Net sales $1,947.2 100.0% $1,586.9 100.0%
Cost of sales 1,528.3 78.5% $3.7 1,298.8 81.8%
Gross profit 418.9 21.5% (3.7) 288.1 18.2%
S, G & A 203.3 10.4% 0.9 180.2 11.4%
Goodwill impairment loss
Other income (deductions)
Interest expense (16.2) -0.8% 0.0 (21.8) -1.4%
Interest & other income (10.7) -0.5% (8.8) (1.5) -0.1%
(26.9) -1.4% (8.8) (23.3) -1.5%
Income before taxes 188.7 9.7% (13.4) 84.6 5.3%
Income taxes 55.9 2.9% 5.0 27.9 1.8%
Net income $132.8 6.8% ($8.4) $56.7 3.6%