
PH
LISTED
NYSE.
Exhibit 99.2
Parker Hannifin Corporation
Quarterly Earnings Release
4th Quarter FY 2005
July 28, 2005
Forward-Looking Statements
Forward-Looking Statements:
Forward-looking statements contained in this and other written and oral reports are made based on known events and circumstances at the time of release, and as such, are subject in the future to unforeseen uncertainties and risks. All statements regarding future performance, earnings projections, events or developments are forward-looking statements. It is possible that the future performance and earnings projections of the company and individual segments may differ materially from current expectations, depending on economic conditions within both its industrial and aerospace markets, and the company's ability to achieve anticipated benefits associated with announced realignment activities, strategic initiatives to improve operating margins, and growth and innovation initiatives. A change in economic conditions in individual markets may have a particularly volatile effect on segment results. Among the other factors which may affect future performance are: changes in business relationships with and purchases by or from major customers or suppliers, including delays or cancellations in shipments; uncertainties surrounding timing, successful completion or integration of acquisitions; threats associated with and efforts to combat terrorism; competitive market conditions and resulting effects on sales and pricing; increases in raw-material costs that cannot be recovered in product pricing; the company’s ability to manage costs related to employee retirement and health care benefits and insurance; and global economic factors, including currency exchange rates, difficulties entering new markets and general economic conditions such as inflation and interest rates. The company makes these statements as of the date of this disclosure, and undertakes no obligation to update them.

Non-GAAP Financial Measure
This presentation reconciles sales amounts reported in accordance with U.S. GAAP to sales amounts adjusted to remove the effects of acquisitions and divestitures made within the prior four quarters as well as the effects of currency exchange rates on sales. The effects of acquisitions and divestitures and currency exchange rates are removed to allow investors and the company to meaningfully evaluate changes in sales on a comparable basis from period to period.

Discussion Agenda
Financial Highlights
Influences on Sales & Earnings
WIN Strategy
Balance Sheet & Cash Flow Trends
Outlook
Questions & Answers
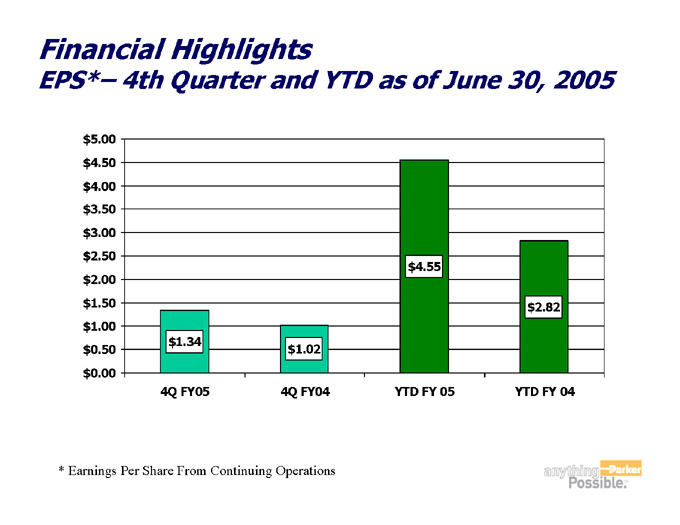
Financial Highlights
EPS* – 4th Quarter and YTD as of June 30, 2005
$5.00 $4.50 $4.00 $3.50 $3.00 $2.50 $2.00 $1.50 $1.00 $0.50 $0.00
$1.34 $1.02 $4.55 $2.82
4Q FY05 4Q FY04 YTD FY 05 YTD FY 04
* Earnings Per Share From Continuing Operations
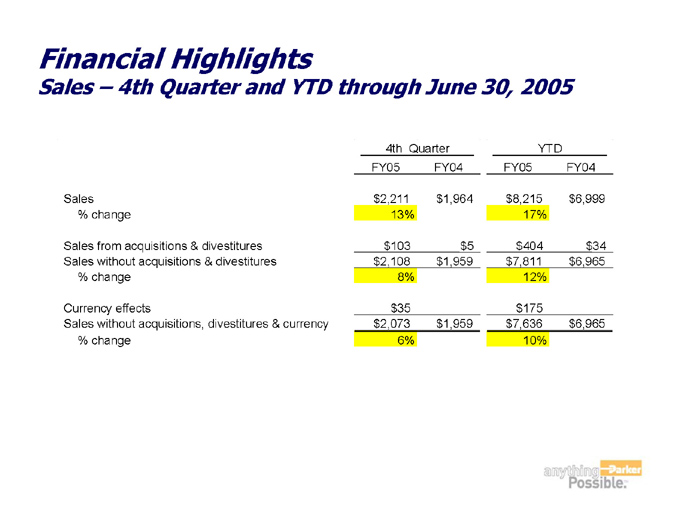
Financial Highlights Sales – 4th Quarter and YTD through June 30, 2005
4th Quarter YTD
FY05 FY04 FY05 FY04
Sales $2,211 $1,964 $8,215 $6,999
% change 13% 17%
Sales from acquisitions & divestitures $103 $5 $404 $34
Sales without acquisitions & divestitures $2,108 $1,959 $7,811 $6,965
% change 8% 12%
Currency effects $35 $175
Sales without acquisitions, divestitures & currency $2,073 $1,959 $7,636 $6,965
% change 6% 10%
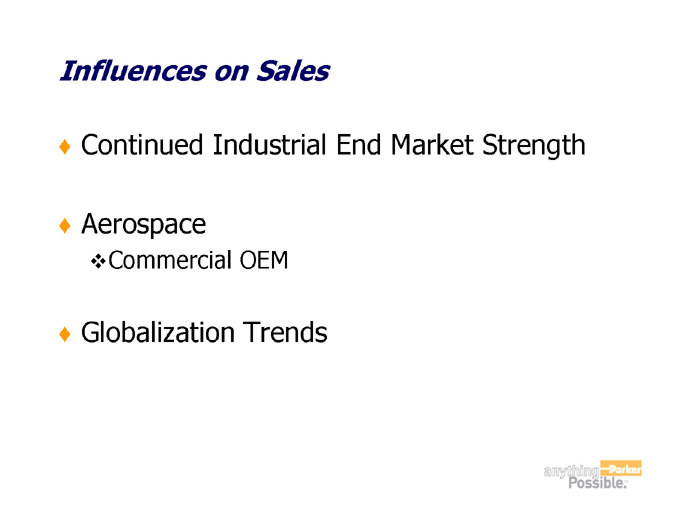
Influences on Sales
Continued Industrial End Market Strength
Aerospace
Commercial OEM
Globalization Trends
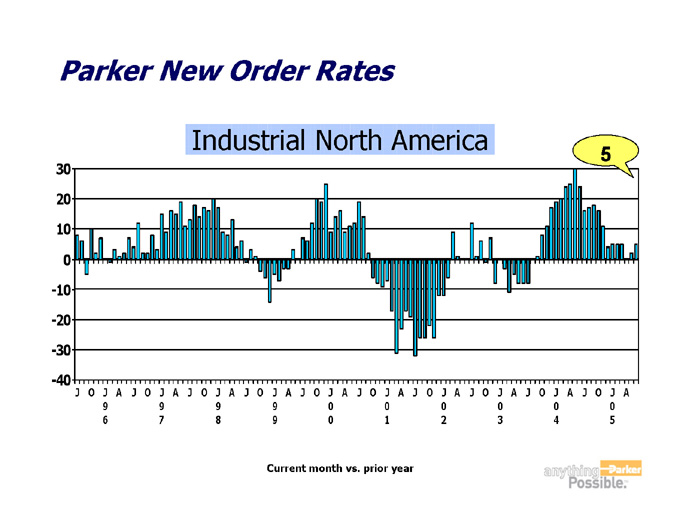
Parker New Order Rates
Industrial North America
5
30 20 10 0 -10 -20 -30 -40
J O J A J O J A J O J A J O J A J O J A J O J A J O J A J O J A J O J A J O J A
9 9 9 9 0 0 0 0 0 0
6 7 8 9 0 1 2 3 4 5
Current month vs. prior year
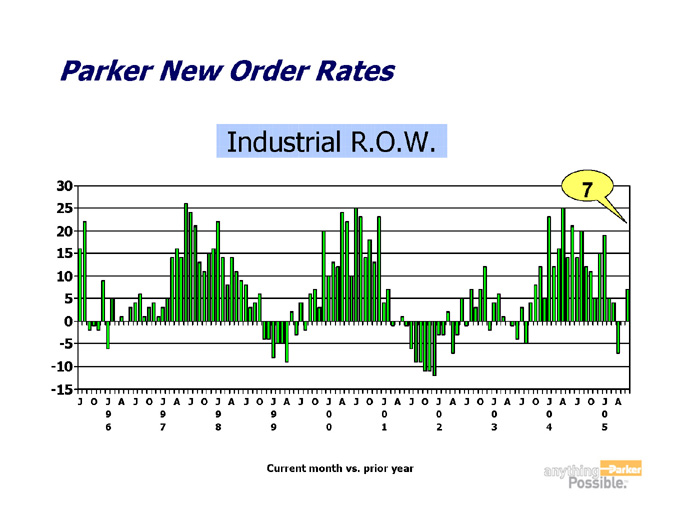
Parker New Order Rates
Industrial R.O.W.
7
30 25 20 15 10 5 0 -5 -10 -15
J O J A J O J A J O J A J O J A J O J A J O J A J O J A J O J A J O J A J O J A
9 9 9 9 0 0 0 0 0 0
6 7 8 9 0 1 2 3 4 5
Current month vs. prior year
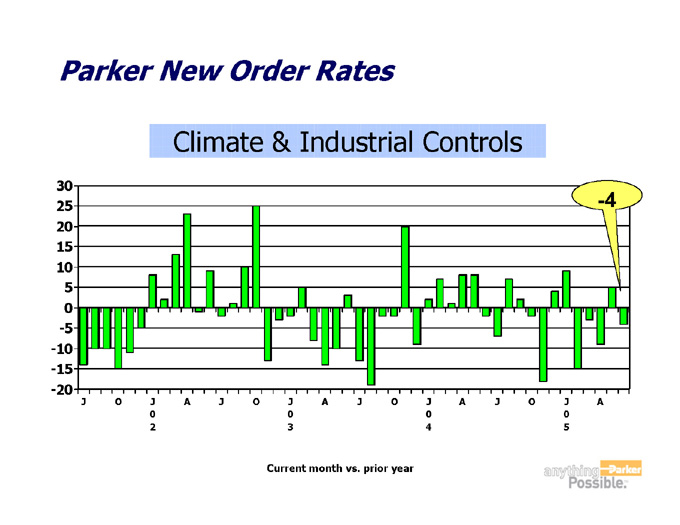
Parker New Order Rates
Climate & Industrial Controls
-4
30 25 20 15 10 5 0 -5 -10 -15 -20
J O J A J O J A J O J A J O J A
0 0 0 0
2 3 4 5
Current month vs. prior year

Parker New Order Rates
Aerospace
7
30 20 10 0 -10 -20 -30
J A J O J A J O J A J O J A J O J A J O J A J O J A J O J A J O J A J O J A
9 9 9 9 0 0 0 0 0 0
6 7 8 9 0 1 2 3 4 5
Average last 12 months orders to previous 12 months orders

Influences on Earnings
Increased Volume
Win Strategy
Restructuring/Move to Low Cost Countries
Sales Mix – Aerospace
Inventory Changes

Segment Reporting
Industrial North America
FY2005 FY2004
4th Qtr YTD 4th Qtr YTD
Sales
As reported $940 $3,517 $848 $3,017
% change 11% 17%
Acquisitions & Divestitures $47 $157 $5 $21
without Acquisitions & Divestitures $893 $3,360 $843 $2,996
% change 6% 12%
Currency effects $5 $13
without Acquisitions, Divestitures, & Currency $888 $3,347 $843 $2,996
% change 5% 12%
Operating Margin
As reported $128 $468 $110 $291
% of sales 14% 13% 13% 10%

Segment Reporting
Industrial Rest of World
FY 2005 FY 2004
4th Qtr YTD 4th Qtr YTD
Sales
As reported $643 $2,398 $565 $1,970
% change 14% 22%
Acquisitions & Divestitures $12 $127
without Acquisitions & Divestitures $631 $2,271 $565 $1,970
% change 12% 15%
Currency effects $25 $134
without Acquisitions, Divestitures, & Currency $606 $2,137 $565 $1,970
% change 7% 8%
Operating Margin
As reported $76 $267 $56 $160
% of sales 12% 11% 10% 8%

Segment Reporting
Aerospace
FY 2005 FY 2004
4th Qtr YTD 4th Qtr YTD
Sales
As reported $364 $1,359 $327 $1,216
% change 11% 12%
Acquisitions & Divestitures
without Acquisitions & Divestitures $364 $1,359 $327 $1,216
% change 11% 12%
Currency effects $0 $5
without Acquisitions, Currency, & Divestitures $364 $1,354 $327 $1,216
% change 11% 11%
Operating Margin
As reported $54 $199 $44 $158
% of sales 15% 15% 13% 13%
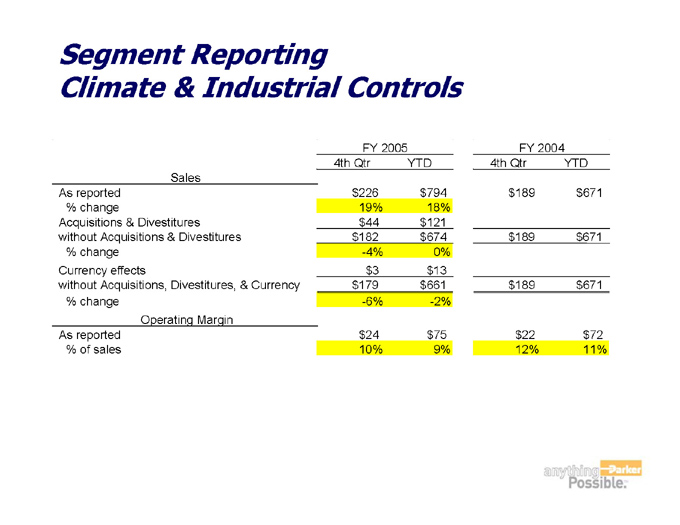
Segment Reporting
Climate & Industrial Controls
FY 2005 FY 2004
4th Qtr YTD 4th Qtr YTD
Sales
As reported $226 $794 $189 $671
% change 19% 18%
Acquisitions & Divestitures $44 $121
without Acquisitions & Divestitures $182 $674 $189 $671
% change -4% 0%
Currency effects $3 $13
without Acquisitions, Divestitures, & Currency $179 $661 $189 $671
% change -6% -2%
Operating Margin
As reported $24 $75 $22 $72
% of sales 10% 9% 12% 11%

Segment Reporting
Other
FY 2005 FY 2004
4th Qtr YTD 4th Qtr YTD
Sales
As reported $38 $146 $35 $125
% change 9% 17%
Acquisitions & Divestitures $14
without Acquisitions & Divestitures $38 $146 $35 $111
% change 9% 32%
Currency effects $2 $11
without Acquisitions, Divestitures & Currency $36 $135 $35 $111
% change 4% 21%
Operating Margin
As reported $5 $18 $5 $8
% of sales 12% 13% 15% 6%
Balance Sheet Summary
Cash
Working Capital
Inventory
Accounts Receivable
PP & E
Shareholders Equity

Financial Leverage
Debt to Debt Equity
38.0% 36.0% 34.0% 32.0% 30.0% 28.0% 26.0% 24.0% 22.0% 20.0%
Target
22.5%
FY99 FY00 FY01 FY02 FY03 FY04 FY05
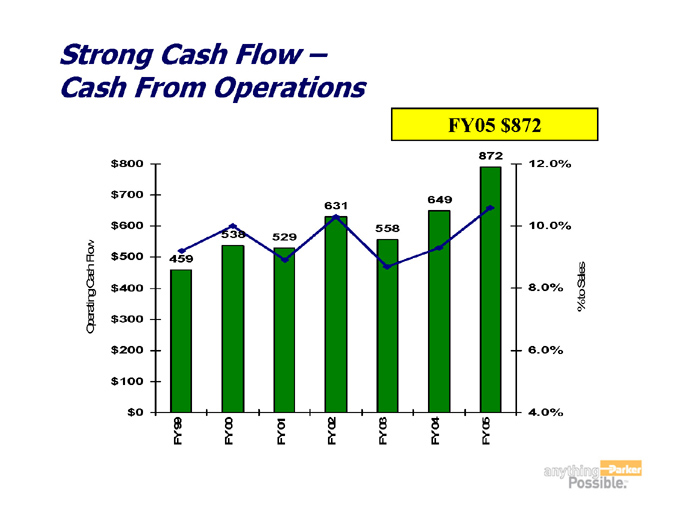
Strong Cash Flow –
Cash From Operations
FY05 $872
Operating Cash Flow
% to Sales
FY 99 459 FY 00 538 FY 01 529 FY 02 631 FY 03 558 FY 04 649 FY 05 872
$800 $700 $600 $500 $400 $300 $200 $100 $0
4.0% 6.0% 8.0% 10.0% 12.0%

FY 2006 Earnings Outlook Assumptions Segment Sales & Operating Income
FY 2006 Sales Change versus FY 2005
NA Industrial 6.5% - 7.2%
Industrial ROW 9.4%-10.4%
Aerospace
6.0% - 7.8% CIC 11.4% - 13.0%
FY 2006 Operating Margin Percentages*
NA Industrial 13.5% - 14.1%
Industrial ROW 11.8% - 12.4%
Aerospace
14.3% -14.7%
CIC 10.6% - 11.7%
*Adoption of FAS 123R by the Company will result in additional expense of approximately $.15-$.20 per diluted share in FY2006. Although this expense will be borne in part by the operating segments beginning in the 1st Quarter of FY2006, the forecasted operating margins do not include such impact because the company has not yet determined the manner in which this expense will be allocated. The margin outlook assumptions as presented are meaningful to investors and the company to the extent they permit an evaluation of future performance on a comparable basis with prior periods which were not impacted by the accounting change.
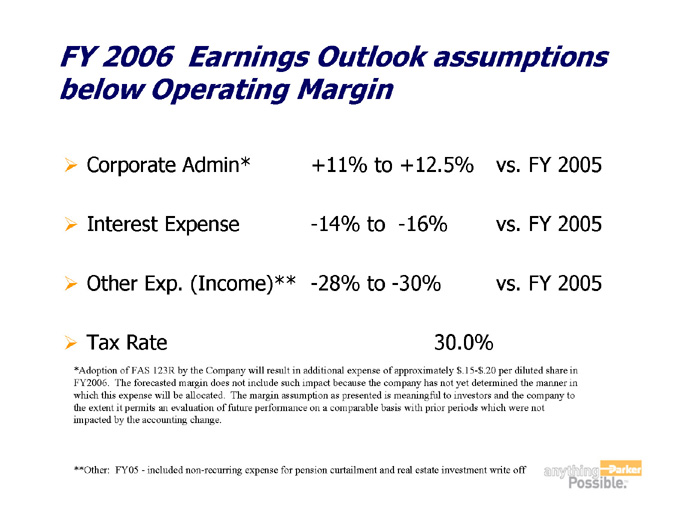
FY 2006 Earnings Outlook assumptions below Operating Margin
Corporate Admin* +11% to +12.5% vs. FY 2005
Interest Expense -14% to -16% vs. FY 2005
Other Exp. (Income)** -28% to - -30% vs. FY 2005
Tax Rate 30.0%
*Adoption of FAS 123R by the Company will result in additional expense of approximately $.15-$.20 per diluted share in FY2006. The forecasted margin does not include such impact because the company has not yet determined the manner in which this expense will be allocated. The margin assumption as presented is meaningful to investors and the company to the extent it permits an evaluation of future performance on a comparable basis with prior periods which were not impacted by the accounting change.
**Other: FY05 - included non-recurring expense for pension curtailment and real estate investment write off
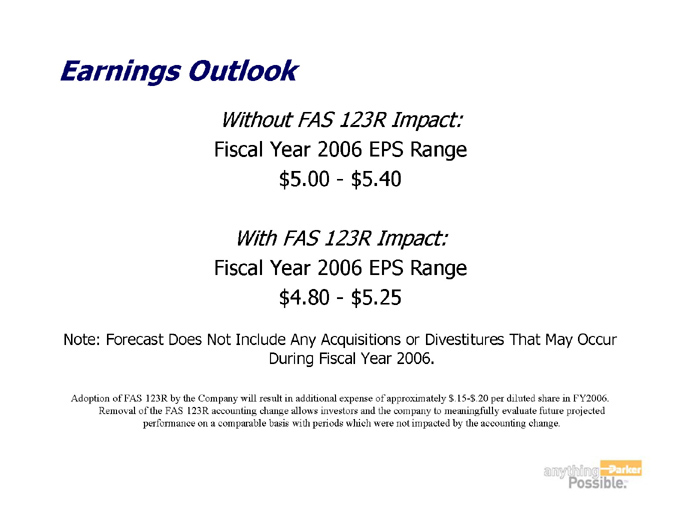
Earnings Outlook
Without FAS 123R Impact:
Fiscal Year 2006 EPS Range
$5.00 - $5.40
With FAS 123R Impact:
Fiscal Year 2006 EPS Range
$4.80 - $5.25
Note: Forecast Does Not Include Any Acquisitions or Divestitures That May Occur During Fiscal Year 2006.
Adoption of FAS 123R by the Company will result in additional expense of approximately $.15-$.20 per diluted share in FY2006. Removal of the FAS 123R accounting change allows investors and the company to meaningfully evaluate future projected performance on a comparable basis with periods which were not impacted by the accounting change.

Questions & Answers...
anything parker Possible TM.

Appendix
Income Statements
&
Quarterly Segment Data
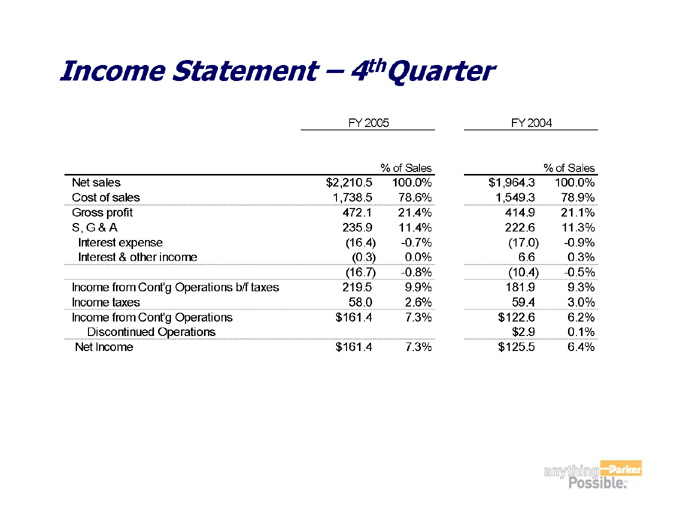
Income Statement - 4thQuarter FY 2004FY 2005
% of Sales % of Sales
100.0%$1,964.3100.0%$2,210.5
Net sales78.9%1,549.3
78.6%1,738.5
Cost of sales21.1%414.921.4%472.1
Gross profit222.611.4%235.9
S, G & A 11.3%(17.0)-0.7%(16.4)
Interest expense-0.9%6.60.0%(0.3)
Interest & other income0.3%-0.5%(10.4)-0.8%(16.7)9.3%181.99.9%219.5
Income from Cont’g Operations b/f taxes59.42.6%58.0
Income taxes3.0%6.2%$122.67.3%$161.4
Income from Cont’g Operations $2.9
Discontinued Operations 0.1% 6.4% $125.5 7.3% $161.4 Net Income

Income Statement – 4th Quarter YTD
FY 2005 FY 2004
% of Sales % of Sales
Net sales $8,215.1 100.0% $6,998.8 100.0%
Cost of sales 6,508.1 79.2% 5,672.3 81.0%
Gross profit 1,707.0 20.8% 1,326.5 19.0%
S, G & A 872.1 10.6% 776.5 11.1%
Interest expense (67.0) -0.8% (73.2) -1.0%
Interest & other income (11.4) -0.1% 3.4 0.0%
(78.4) -1.0% (69.8) -1.0%
Income from Cont'g Operations b/f taxes 756.5 9.2% 480.1 6.9%
Income taxes 208.5 2.5% 144.0 2.1%
Income from Cont'g Operations $548.0 6.7% $336.2 4.8%
Discontinued Operations $56.7 0.7% $9.6 0.1%
Net Income $604.7 7.4% $345.8 4.9%
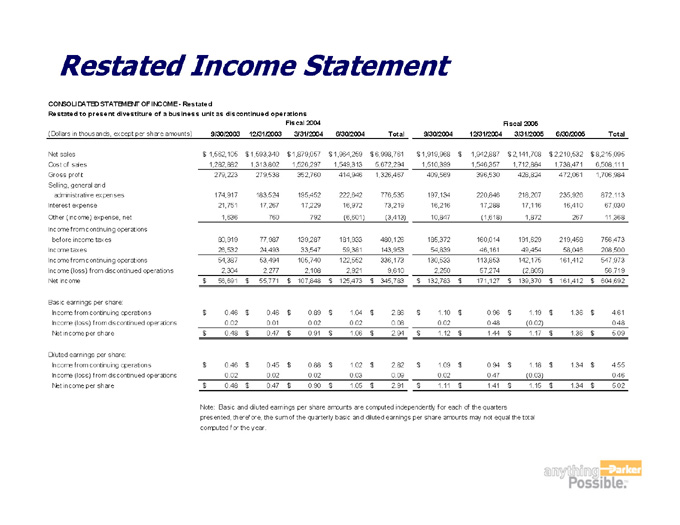
Restated Income Statement
CONSOLIDATED STATEMENT OF INCOME - Restated
Restated to present divestiture of a business unit as discontinued operations
Fiscal 2004 Fiscal 2005
(Dollars in thousands, except per share amounts) 9/30/2003 12/31/2003 3/31/2004
6/30/2004 Total 9/30/2004 12/31/2004 3/31/2005 6/30/2005 Total
Net sales $ 1,562,105 $ 1,593,340 $ 1,879,057 $ 1,964,259 $ 6,998,761 $ 1,919,968 $ 1,942,887 $ 2,141,708 $ 2,210,532 $ 8,215,095
Cost of sales 1,282,882 1,313,802 1,526,297 1,549,313 5,672,294 1,510,399 1,546,357 1,712,884 1,738,471 6,508,111
Gross profit 279,223 279,538 352,760 414,946 1,326,467 409,569 396,530 428,824 472,061 1,706,984
Selling, general and
administrative expenses 174,917 183,524 195,452 222,642 776,535 197,134 220,846 218,207 235,926 872,113
Interest expense 21,751 17,267 17,229 16,972 73,219 16,216 17,288 17,116 16,410 67,030
Other (income) expense, net 1,636 760 792 (6,601) (3,413) 10,847 (1,618) 1,872 267 11,368
Income from continuing operations
before income taxes 80,919 77,987 139,287 181,933 480,126 185,372 160,014 191,629 219,458 756,473
Income taxes 26,532 24,493 33,547 59,381 143,953 54,839 46,161 49,454 58,046 208,500
Income from continuing operations 54,387 53,494 105,740 122,552 336,173 130,533 113,853 142,175 161,412 547,973
Income (loss) from discontinued operations 2,304 2,277 2,108 2,921 9,610 2,250 57,274 (2,805) 56,719
Net income $ 56,691 $ 55,771 $ 107,848 $ 125,473 $ 345,783 $ 132,783 $ 171,127 $ 139,370 $ 161,412 $ 604,692
Basic earnings per share:
Income from continuing operations $ 0.46 $ 0.46 $ 0.89 $ 1.04 $ 2.86 $ 1.10 $ 0.96 $ 1.19 $ 1.36 $ 4.61
Income (loss) from discontinued operations 0.02 0.01 0.02 0.02 0.08 0.02 0.48 (0.02) 0.48
Net income per share $ 0.48 $ 0.47 $ 0.91 $ 1.06 $ 2.94 $ 1.12 $ 1.44 $ 1.17 $ 1.36 $ 5.09
Diluted earnings per share:
Income from continuing operations $ 0.46 $ 0.45 $ 0.88 $ 1.02 $ 2.82 $ 1.09 $ 0.94 $ 1.18 $ 1.34 $ 4.55
Income (loss) from discontinued operations 0.02 0.02 0.02 0.03 0.09 0.02 0.47 (0.03) 0.46
Net income per share $ 0.48 $ 0.47 $ 0.90 $ 1.05 $ 2.91 $ 1.11 $ 1.41 $ 1.15 $ 1.34 $ 5.02
Note: Basic and diluted earnings per share amounts are computed independently for each of the quarters
presented, therefore, the sum of the quarterly basic and diluted earnings per share amounts may not equal the total
computed for the year.
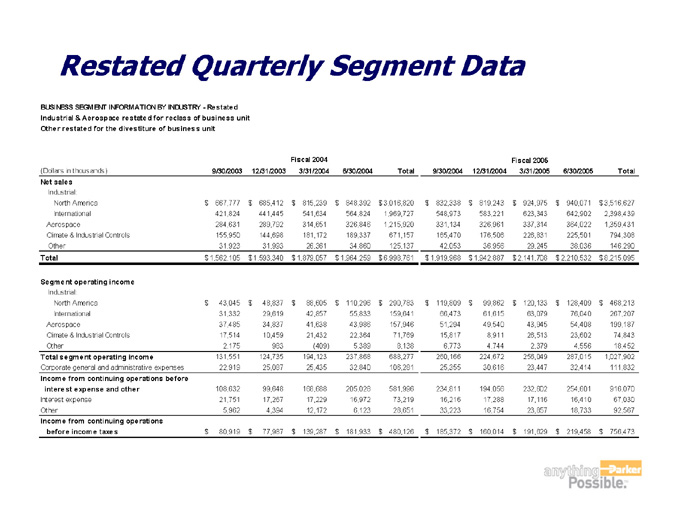
Restated Quarterly Segment Data
BUSINESS SEGMENT INFORMATION BY INDUSTRY - Restated
Industrial & Aerospace restated for reclass of business unit
Other restated for the divestiture of business unit
Fiscal 2004 Fiscal 2005
(Dollars in thousands) 9/30/2003 12/31/2003 3/31/2004 6/30/2004
Total 9/30/2004 12/31/2004 3/31/2005 6/30/2005 Total
Net sales
Industrial:
North America $ 667,777 $ 685,412 $ 815,239 $ 848,392 $ 3,016,820 $ 832,338 $ 819,243 $ 924,975 $ 940,071 $ 3,516,627
International 421,824 441,445 541,634 564,824 1,969,727 548,973 583,221 623,343 642,902 2,398,439
Aerospace 284,631 289,792 314,651 326,846 1,215,920 331,134 326,961 337,314 364,022 1,359,431
Climate & Industrial Controls 155,950 144,698 181,172 189,337 671,157 165,470 176,506 226,831 225,501 794,308
Other 31,923 31,993 26,361 34,860 125,137 42,053 36,956 29,245 38,036 146,290
Total $ 1,562,105 $ 1,593,340 $ 1,879,057 $ 1,964,259 $ 6,998,761 $ 1,919,968 $ 1,942,887 $ 2,141,708 $ 2,210,532 $ 8,215,095
Segment operating income
Industrial:
North America $ 43,045 $ 48,837 $ 88,605 $ 110,296 $ 290,783 $ 119,809 $ 99,862 $ 120,133 $ 128,409 $ 468,213
International 31,332 29,619 42,857 55,833 159,641 66,473 61,615 63,079 76,040 267,207
Aerospace 37,485 34,837 41,638 43,986 157,946 51,294 49,540 43,945 54,408 199,187
Climate & Industrial Controls 17,514 10,459 21,432 22,364 71,769 15,817 8,911 26,513 23,602 74,843
Other 2,175 983 (409) 5,389 8,138 6,773 4,744 2,379 4,556 18,452
Total segment operating income 131,551 124,735 194,123 237,868 688,277 260,166 224,672 256,049 287,015 1,027,902
Corporate general and administrative expenses 22,919 25,087 25,435 32,840 106,281 25,355 30,616 23,447 32,414 111,832
Income from continuing operations before
interest expense and other 108,632 99,648 168,688 205,028 581,996 234,811 194,056 232,602 254,601 916,070
Interest expense 21,751 17,267 17,229 16,972 73,219 16,216 17,288 17,116 16,410 67,030
Other 5,962 4,394 12,172 6,123 28,651 33,223 16,754 23,857 18,733 92,567
Income from continuing operations
before income taxes $ 80,919 $ 77,987 $ 139,287 $ 181,933 $ 480,126 $ 185,372 $ 160,014 $ 191,629 $ 219,458 $ 756,473