
Parker Hannifin
Corporation
Quarterly Earnings Release
2nd Quarter FY 2006
January 18, 2006
Exhibit 99.2
| Parker Hannifin
Corporation Quarterly Earnings Release 2nd Quarter FY 2006 January 18, 2006 Exhibit 99.2 |
 Forward-Looking
Statements Forward-Looking Statements: Forward-looking statements contained in this and other written and oral reports are made based on known events and circumstances at the time of release, and as such, are subject in the future to unforeseen uncertainties and risks. All statements regarding future performance, earnings projections, events or developments are forward-looking statements. It is possible that the future performance and earnings projections of the company and individual segments may differ materially from current expectations, depending on economic conditions within both its industrial and aerospace markets, and the company's ability to achieve anticipated benefits associated with announced realignment activities, strategic initiatives to improve operating margins, and growth and innovation initiatives. A change in economic conditions in individual markets may have a particularly volatile effect on segment results. Among the other factors which may affect future performance are: changes in business relationships with and purchases by or from major customers or suppliers, including delays or cancellations in shipments; uncertainties surrounding timing, successful completion or integration of acquisitions; threats associated with and efforts to combat terrorism; competitive market conditions and resulting effects on sales and pricing; increases in raw- material costs that cannot be recovered in product pricing; the company’s ability to manage costs related to employee retirement and health care benefits and insurance; and global economic factors, including manufacturing activity, air travel trends, currency exchange rates, difficulties entering new markets and general economic conditions such as inflation and interest rates. The company makes these statements as of the date of this disclosure, and undertakes no obligation to update them. |
 Non-GAAP
Financial Measure This presentation reconciles sales amounts reported in accordance with U.S. GAAP to sales amounts adjusted to remove the effects of acquisitions and divestitures made within the prior four quarters as well as the effects of currency exchange rates on sales. The effects of acquisitions and currency exchange rates are removed to allow investors and the company to meaningfully evaluate changes in sales on a comparable basis from period to period. This presentation contains references to earnings per share amounts excluding the effect of the adoption of FAS 123R and/or a loss recognized on the sale of a division. The removal of both the FAS 123R effect and the loss on the sale of a division allows investors and the company to meaningfully evaluate performance on a comparable basis with the prior period, which was not impacted by FAS 123R or the sale of a division. |
 Discussion
Agenda Financial Highlights Outlook Questions & Answers CEO Comments |
 Financial
Highlights EPS – 2nd Quarter and YTD as of Dec 31st FY2006 FY2005 FY 2006 FY 2005 EPS as Reported 1.07 $ 1.41 $ 2.51 $ 2.52 $ Discontinued Operations - 0.50 0.24 0.56 EPS from Continuing Operations as reported 1.07 $ 0.91 $ 2.27 $ 1.96 $ Loss on Sale of Thermoplastics 0.08 - 0.08 - FAS 123R expense 0.03 - 0.13 - EPS from Continuing Operations Adjusted 1.18 $ 0.91 $ 2.48 $ 1.96 $ First Six Months Second Quarter |
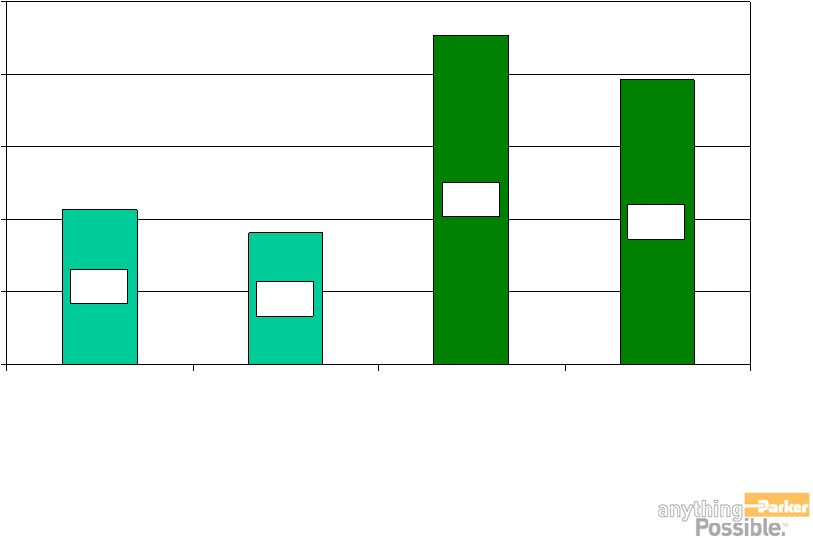 Financial
Highlights EPS from Continuing Operations 2nd Quarter and YTD as of Dec 31st $0.91 $1.96 $2.27 $1.07 $0.00 $0.50 $1.00 $1.50 $2.00 $2.50 Q2 FY06 Q2 FY05 YTD FY06 YTD FY05 |
 Influences on
Earnings Increased Volume Win Strategy Restructuring/Move to Low Cost Countries Sales Mix – Aerospace Inventory Changes |
 Financial
Highlights Sales – 2nd Quarter and YTD through December 31 FY06 FY05 FY06 FY05 Sales $2,158 $1,906 $4,271 $3,784 % change 13% 13% Sales from acquisitions & divestitures $162 $298 Sales without acquisitions & divestitures $1,996 $1,906 $3,973 $3,784 % change 5% 5% Currency effects ($46) ($30) Sales without acquisitions, divestitures & currency $2,042 $1,906 $4,003 $3,784 % change 7% 6% 2nd Quarter YTD |
 Influences on
Sales Continued Industrial End Market Strength Aerospace Commercial OEM Globalization Trends Acquisitions |
 Segment
Reporting Industrial North America 2nd Qtr YTD 2nd Qtr YTD Sales As reported $930 $1,859 $819 $1,652 % change 13% 13% Acquisitions $65 $118 without Acquisitions $865 $1,741 $819 $1,652 % change 6% 5% Currency effects $3 $7 without Acquisitions & Currency $862 $1,734 $819 $1,652 % change 5% 5% Operating Margin As reported $130 $267 $100 $220 % of sales 14% 14% 12% 13% FY2006 FY2005 |
 Segment
Reporting Industrial Rest of World 2nd Qtr YTD 2nd Qtr YTD Sales As reported $677 $1,297 $583 $1,132 % change 16% 15% Acquisitions $95 $133 without Acquisitions $582 $1,164 $583 $1,132 % change 0% 3% Currency effects ($45) ($35) without Acquisitions & Currency $627 $1,199 $583 $1,132 % change 7% 6% Operating Margin As reported $68 $149 $62 $128 % of sales 10% 11% 11% 11% FY 2006 FY 2005 |
 Segment
Reporting Aerospace 2nd Qtr YTD 2nd Qtr YTD Sales As reported $345 $694 $327 $658 % change 6% 5% Acquisitions without Acquisitions $345 $694 $327 $658 % change 6% 5% Currency effects ($3) ($3) without Acquisitions $348 $697 $327 $658 % change 6% 6% Operating Margin As reported $47 $102 $50 $101 % of sales 14% 15% 15% 15% FY 2006 FY 2005 |
 Segment
Reporting Climate & Industrial Controls 2nd Qtr YTD 2nd Qtr YTD Sales As reported $206 $421 $177 $342 % change 17% 23% Acquisitions $2 $47 without Acquisitions $204 $374 $177 $342 % change 15% 9% Currency effects ($1) $1 without Acquisitions & Currency $205 $373 $177 $342 % change 16% 9% Operating Margin As reported $10 $29 $9 $25 % of sales 5% 7% 5% 7% FY 2006 FY 2005 |
 Fiscal YTD
Results Sales Increased 12.9% Cash flow from operations - 1 st Half record, reaching 10.1% of sales Earnings from continuing operations per diluted share of $2.27, up 16% from $1.96 last year |
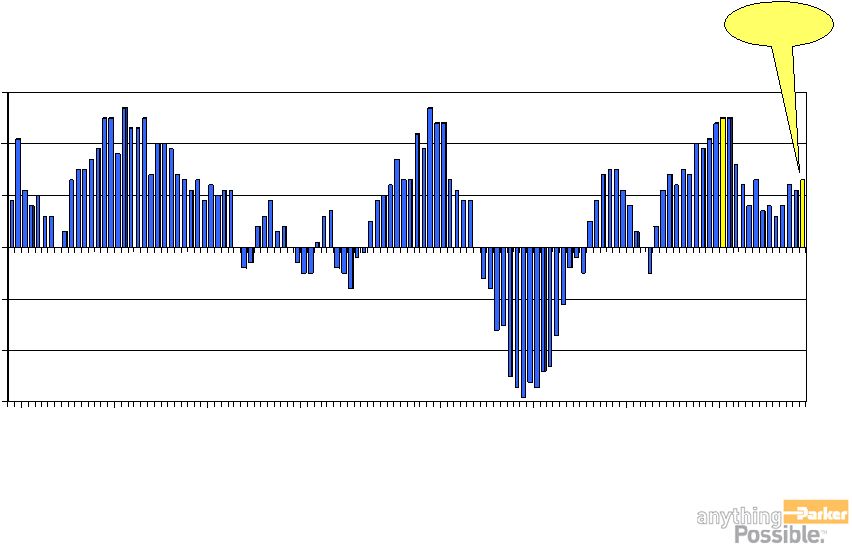
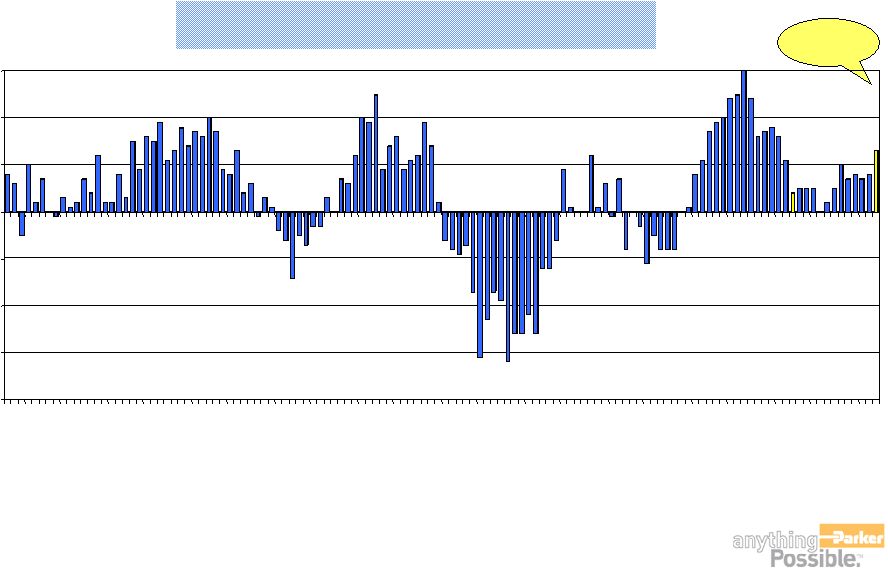 Current month
vs. prior year Parker New Order Rates Industrial North America 13 -40 J O J 9 6 A J O J 9 7 A J O J 9 8 A J O J 9 9 A J O J 0 0 A J O J 0 1 A J O J 0 2 A J O J 0 3 A J O J 0 4 A J O J 0 5 A J O -30 -20 -10 0 10 20 30 |
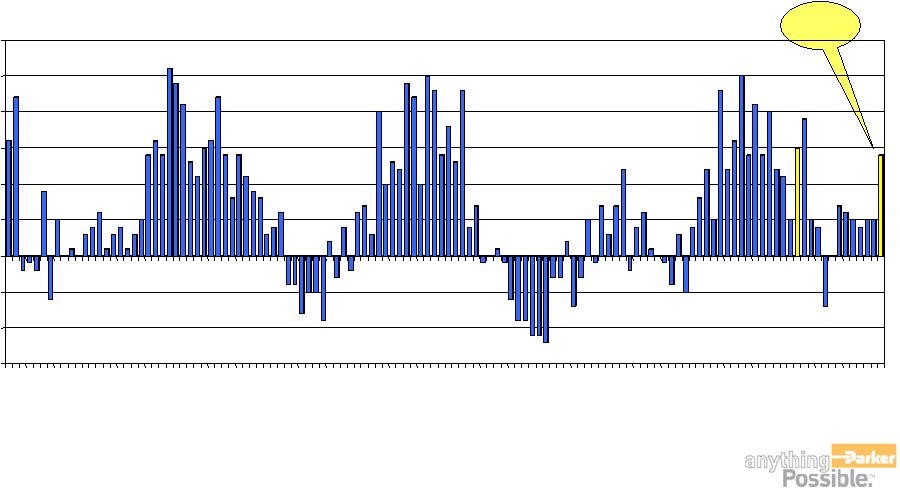  Industrial
R.O.W. Current month vs. prior year 14 Parker New Order Rates -15 -10 -5 0 5 10 15 20 25 30 J O J A J O J A J O J A J O J A J O J A J O J A J O J A J O J A J O J A J O J A J O |
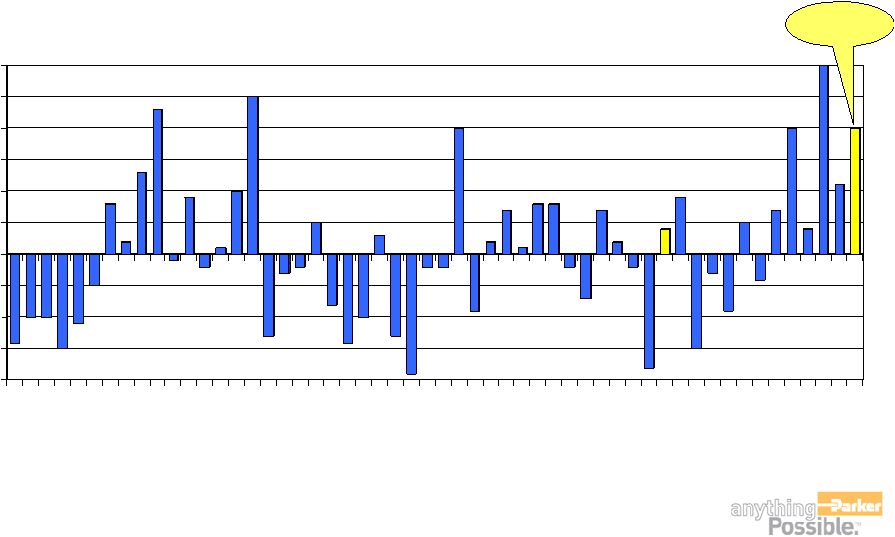  Climate &
Industrial Controls Current month vs. prior year -20 -15 -10 -5 0 5 10 15 20 25 30 J O J 0 2 A J O J 0 3 A J O J 0 4 A J O J 0 5 A J O 20 Parker New Order Rates |
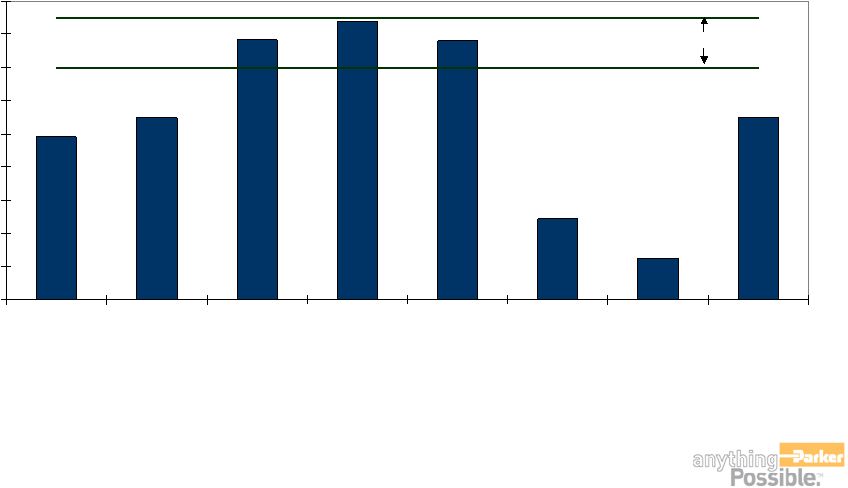
  Aerospace
Average last 12 months orders to previous 12 months orders Parker New Order Rates -30 -20 -10 0 10 20 30 J 9 6 A J O J 9 7 A J O J 9 8 A J O J 9 9 A J O J 0 0 A J O J 0 1 A J O J 0 2 A J O J 0 3 A J O J 0 4 A J O J 0 5 A J O 13 |
 Balance Sheet
Summary Cash Working Capital Inventory Accounts Receivable PP & E Shareholders Equity |
 Financial
Leverage Debt to Debt Equity 31.0% 20.0% 22.0% 24.0% 26.0% 28.0% 30.0% 32.0% 34.0% 36.0% 38.0% FY99 FY00 FY01 FY02 FY03 FY04 FY05 FY06 Target |
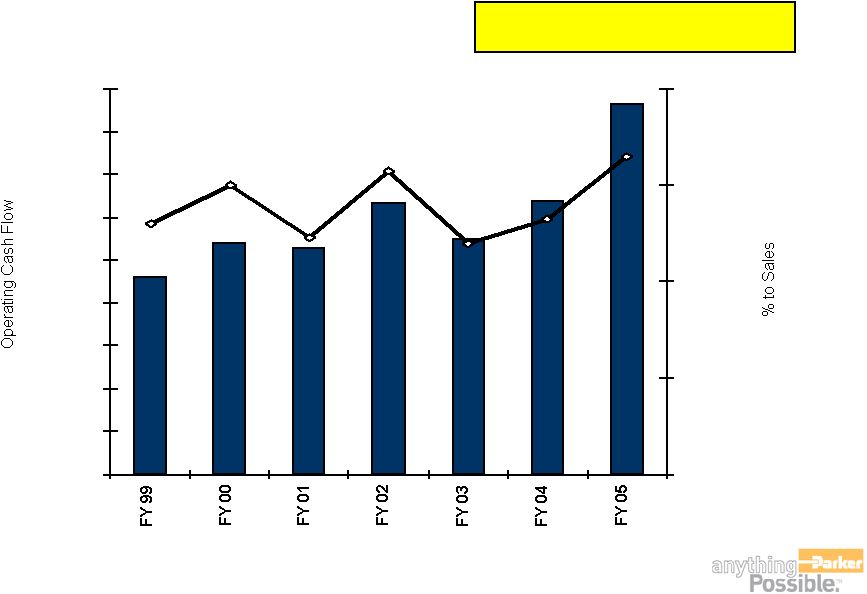 Strong Cash Flow
– Cash From Operations FY06 YTD $429 459 538 529 631 551 638 864 $0 $100 $200 $300 $400 $500 $600 $700 $800 $900 4.0% 6.0% 8.0% 10.0% 12.0% |
 FY 2006
Earnings Outlook Assumptions Segment Sales & Operating Income FY 2006 Sales Change versus FY 2005 18.5% - 17.0% CIC 7.8% - 7.0% Aerospace 18.0% - 16.6% Industrial ROW 12.8% - 12.4% NA Industrial FY 2006 Operating Margin Percentages 9.1% - 8.9% CIC 14.7% - 14.3% Aerospace 11.8% - 11.2% Industrial ROW 14.6% - 14.2% NA Industrial |
 FY 2006
Earnings Outlook assumptions below Operating Margin Corporate Admin +11.5% to +12.5% vs. FY 2005 Interest Expense +11.6% to +12.5% vs. FY 2005 Other Exp. (Income) * +25% to +35% vs. FY 2005 Tax Rate 28.5% *Adoption of FAS 123R by the Company will result in additional expense of
approximately $.20 per diluted share in Fiscal Year 2006 all of
which will be reflected in the Other Expense (Income) line. Loss on sale of Thermoplastics is also included in the Other Expense (Income) line. |
 Earnings
Outlook Low High Previous guidance, income from continuing operations $4.85 $5.30 Revised guidance, income from continuing operations $4.97 $5.22 including loss from divestiture Revised guidance, income from continuing operations $5.05 $5.30 excluding loss from divestiture |
 Questions &
Answers... |
 Appendix
Income Statements & Quarterly Segment Data * * * * * * * * * * * * * * * * * * * * * |
 Income Statement
– 2nd Quarter % of Sales % of Sales Net sales $2,157.5 100.0% $1,905.9 100.0% Cost of sales 1,705.7 79.1% 1,516.9 79.6% Gross profit 451.8 20.9% 389.0 20.4% S, G & A 245.8 11.4% 217.8 11.4% Interest expense 19.6 0.9% 17.2 0.9% Other expense 10.9 0.5% (1.4) -0.1% Income from Cont'g Operations b/f taxes 175.5 8.1% 155.4 8.2% Income taxes 46.5 2.2% 45.0 2.4% Income from Cont'g Operations $129.0 6.0% $110.5 5.8% Discontinued Operations 0.0% 60.7 3.2% Net Income $129.0 6.0% $171.2 9.0% FY 2006 FY 2005 |
 Income Statement
– 2nd Quarter YTD % of Sales % of Sales Net sales $4,271.1 100.0% $3,783.8 100.0% Cost of sales 3,361.4 78.7% 2,994.6 79.1% Gross profit 909.7 21.3% 789.2 20.9% S, G & A 482.9 11.3% 412.3 10.9% Interest expense 36.1 0.8% 33.4 0.9% Interest & other income 11.2 0.3% 9.5 0.3% Income from Cont'g Operations b/f taxes 379.6 8.9% 334.0 8.8% Income taxes 106.7 2.5% 97.6 2.6% Income from Cont'g Operations $272.9 6.4% $236.4 6.2% Discontinued Operations $28.9 0.7% $67.5 1.8% Net Income $301.8 7.1% $303.9 8.0% FY 2006 FY 2005 |
  Restated Income
Statement CONSOLIDATED STATEMENT OF INCOME - Restated Restated to present divestiture of business units as discontinued operations (Dollars in thousands, except per share amounts) 9/30/2004 12/31/2004 3/31/2005 6/30/2005 Total Net sales 1,877,915 $ 1,905,931 $ 2,112,462 $ 2,172,497 $ 8,068,805 $ Cost of sales 1,477,694 1,516,905 1,688,804 1,708,074 6,391,477 Gross profit 400,221 389,026 423,658 464,423 1,677,328 Selling, general and administrative expenses 194,396 217,856 215,231 232,795 860,278 Interest expense 16,179 17,236 17,079 16,375 66,869 Other expense (income), net 10,975 (1,433) 2,026 342 11,910 Income from continuing operations before income taxes 178,671 155,367 189,322 214,911 738,271 Income taxes 52,635 44,954 48,676 58,840 205,105 Income from continuing operations 126,036 110,413 140,646 156,071 533,166 Income (loss) from discontinued operations 6,747 60,714 (1,276) 5,341 71,526 Net income 132,783 $ 171,127 $ 139,370 $ 161,412 $ 604,692 $ Basic earnings per share: Income from continuing operations 1.06 $ 0.93 $ 1.18 $ 1.32 $ 4.49 $ Income (loss) from discontinued operations 0.06 0.51 (0.01) 0.04 0.60 Net income per share 1.12 $ 1.44 $ 1.17 $ 1.36 $ 5.09 $ Diluted earnings per share: Income from continuing operations 1.05 $ 0.91 $ 1.16 $ 1.30 $ 4.43 $ Income (loss) from discontinued operations 0.06 0.50 (0.01) 0.04 0.59 Net income per share 1.11 $ 1.41 $ 1.15 $ 1.34 $ 5.02 $ Note: Basic and diluted earnings per share amounts are computed independently for each of the
quarters presented, therefore, the sum of the quarterly basic and diluted earnings per share
amounts may not equal the total computed for the year. Fiscal 2005 |
  Restated Quarterly
Segment Data BUSINESS SEGMENT INFORMATION BY INDUSTRY - Restated Elimination of Other Segment due to divestiture of business units (Dollars in thousands) 9/30/2004 12/31/2004 3/31/2005 6/30/2005 Total Net sales Industrial: North America 832,338 $ 819,243 $ 924,975 $ 940,071 $ 3,516,627 $ International 548,973 583,221 623,343 642,902 2,398,439 Aerospace 331,134 326,961 337,313 364,023 1,359,431 Climate & Industrial Controls 165,470 176,506 226,831 225,501 794,308 Total 1,877,915 $ 1,905,931 $ 2,112,462 $ 2,172,497 $ 8,068,805 $ Segment operating income Industrial: North America 119,809 $ 99,862 $ 120,133 $ 128,409 $ 468,213 $ International 66,473 61,615 63,079 76,040 267,207 Aerospace 51,294 49,540 43,945 54,408 199,187 Climate & Industrial Controls 15,817 8,911 26,513 23,602 74,843 Total segment operating income 253,393 219,928 253,670 282,459 1,009,450 Corporate general and administrative expenses 25,306 30,563 23,395 32,351 111,615 Income from continuing operations before interest expense and other 228,087 189,365 230,275 250,108 897,835 Interest expense 16,179 17,236 17,079 16,375 66,869 Other 33,237 16,762 23,874 18,822 92,695 Income from continuing operations before income taxes 178,671 $ 155,367 $ 189,322 $ 214,911 $ 738,271 $ Fiscal 2005 |