
Parker Hannifin
Corporation
Quarterly Earnings Release
3rd Quarter FY 2006
April 18, 2006
.
Exhibit 99.2
| Parker Hannifin
Corporation Quarterly Earnings Release 3rd Quarter FY 2006 April 18, 2006 . Exhibit 99.2 |
 Forward-Looking
Statements Forward-Looking Statements: Forward-looking statements contained in this and other written and oral reports are
made based on known events and circumstances at the time of release, and as
such, are subject in the future to unforeseen uncertainties and risks. All
statements regarding future performance, earnings projections, events or developments are forward-looking statements. It is possible that the future
performance and earnings projections of the company and individual segments
may differ materially from current expectations, depending on economic
conditions within both its industrial and aerospace markets, and the company's ability to achieve anticipated benefits associated with announced realignment
activities, strategic initiatives to improve operating margins, and growth
and innovation initiatives. A change in economic conditions in individual
markets may have a particularly volatile effect on segment results. Among the other factors which may affect future performance are: changes in business relationships with and
purchases by or from major customers or suppliers, including delays or
cancellations in shipments; uncertainties surrounding timing, successful
completion or integration of acquisitions; threats associated with and efforts to combat terrorism; competitive market conditions and resulting effects on sales and pricing;
increases in raw- material costs that cannot be recovered in product
pricing; the company’s ability to manage costs related to employee
retirement and health care benefits and insurance; and global economic factors, including manufacturing activity, air travel trends, currency exchange rates, difficulties
entering new markets and general economic conditions such as inflation and
interest rates. The company makes these statements as of the date of this
disclosure, and undertakes no obligation to update them. |
 Non-GAAP
Financial Measure This presentation reconciles sales amounts reported in accordance with
U.S. GAAP to sales amounts adjusted to remove the effects of acquisitions and divestitures made within the prior four quarters as well as the effects of currency exchange rates on sales. The effects of acquisitions and currency exchange rates are removed to allow investors and the company to meaningfully evaluate changes in sales on a comparable basis from period to period. This presentation contains references to earnings per share amounts excluding the effect of the adoption of FAS 123R, a litigation settlement, and a loss recognized on the sale of a division. The removal of the FAS 123R effect, the litigation settlement and the loss on the sale of a division allows investors and the company to meaningfully evaluate performance on a comparable basis with the prior period, which was not impacted by FAS 123R, the litigation settlement or the sale of a division. |
 Discussion
Agenda Financial Highlights Outlook Questions & Answers CEO Comments |
 Financial
Highlights EPS – 3rd Quarter and YTD as of March 31st FY2006 FY2005 FY 2006 FY 2005 EPS as Reported 1.46 $ 1.15 $ 3.97 $ 3.68 $ Discontinued Operations - (0.01) 0.24 0.55 EPS from Continuing Operations as reported 1.46 $ 1.16 $ 3.73 $ 3.13 $ Loss on Sale of Thermoplastics - - 0.08 - Litigation Settlement (0.03) - (0.03) - FAS 123R expense 0.03 - 0.16 - EPS from Continuing Operations Adjusted 1.46 $ 1.16 $ 3.94 $ 3.13 $ First Nine Months Third Quarter |
 Financial
Highlights EPS from Continuing Operations 3rd Quarter and YTD as of March 31st $1.16 $3.13 $3.73 $1.46 $0.00 $0.50 $1.00 $1.50 $2.00 $2.50 $3.00 $3.50 $4.00 Q3 FY06 Q3 FY05 YTD FY06 YTD FY05 |
 Influences on
Earnings Increased Volume Win Strategy Restructuring/Move to Low Cost Countries Sales Mix – Aerospace Inventory Changes |
 Financial
Highlights Sales – 3rd Quarter and YTD through March 31st FY06 FY05 FY06 FY05 Sales $2,498 $2,112 $6,769 $5,896 % change 18% 15% Sales from acquisitions & divestitures $203 $500 Sales without acquisitions & divestitures $2,295 $2,112 $6,269 $5,896 % change 9% 6% Currency effects ($37) ($67) Sales without acquisitions, divestitures & currency $2,332 $2,112 $6,336 $5,896 % change 10% 7% 3rd Quarter YTD |
 Influences on
Sales Continued Industrial End Market Strength Aerospace Commercial OEM Globalization Trends Acquisitions |
 Segment
Reporting Industrial North America 3rd Qtr YTD 3rd Qtr YTD Sales As reported $1,063 $2,922 $925 $2,577 % change 15% 13% Acquisitions $60 $177 without Acquisitions $1,003 $2,745 $925 $2,577 % change 8% 7% Currency effects $5 $12 without Acquisitions & Currency $998 $2,733 $925 $2,577 % change 8% 6% Operating Margin As reported $165 $432 $120 $340 % of sales 15% 15% 13% 13% FY2006 FY2005 |
 Segment
Reporting Industrial Rest of World 3rd Qtr YTD 3rd Qtr YTD Sales As reported $774 $2,071 $623 $1,756 % change 24% 18% Acquisitions $118 $251 without Acquisitions $656 $1,820 $623 $1,756 % change 5% 4% Currency effects ($39) ($74) without Acquisitions & Currency $695 $1,894 $623 $1,756 % change 12% 8% Operating Margin As reported $99 $247 $63 $191 % of sales 13% 12% 10% 11% FY 2006 FY 2005 |
 Segment
Reporting Aerospace 3rd Qtr YTD 3rd Qtr YTD Sales As reported $391 $1,085 $337 $995 % change 16% 9% Acquisitions without Acquisitions $391 $1,085 $337 $995 % change 16% 9% Currency effects ($2) ($4) without Acquisitions $393 $1,089 $337 $995 % change 17% 9% Operating Margin As reported $54 $157 $44 $145 % of sales 14% 14% 13% 15% FY 2006 FY 2005 |
 Segment
Reporting Climate & Industrial Controls 3rd Qtr YTD 3rd Qtr YTD Sales As reported $270 $691 $227 $569 % change 19% 22% Acquisitions $25 $72 without Acquisitions $245 $619 $227 $569 % change 8% 9% Currency effects ($1) without Acquisitions & Currency $246 $619 $227 $569 % change 8% 9% Operating Margin As reported $24 $52 $27 $51 % of sales 9% 8% 12% 9% FY 2006 FY 2005 |
 Fiscal YTD
Results Sales Increased 14.8% 7.4% Organic Growth Cash flow from operations -9.0% of sales Earnings from continuing operations per diluted share of $3.73, up 19.2% from $3.13 last year |
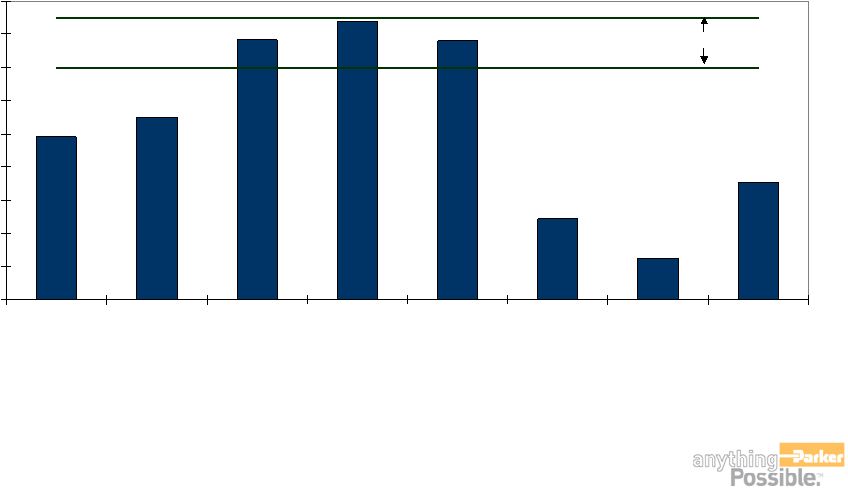
 Year over Year
Comparisons Excludes Acquisitions & Currency Aerospace Calculated on 12-Month Moving Average Parker New Order Rates March-06 March-05 March-04 North American Industrial +3% +5% +24% International Industrial +2% +4% +16% Aerospace +23% +12% +11% Climate & Industrial Controls +14% -3% +1% |
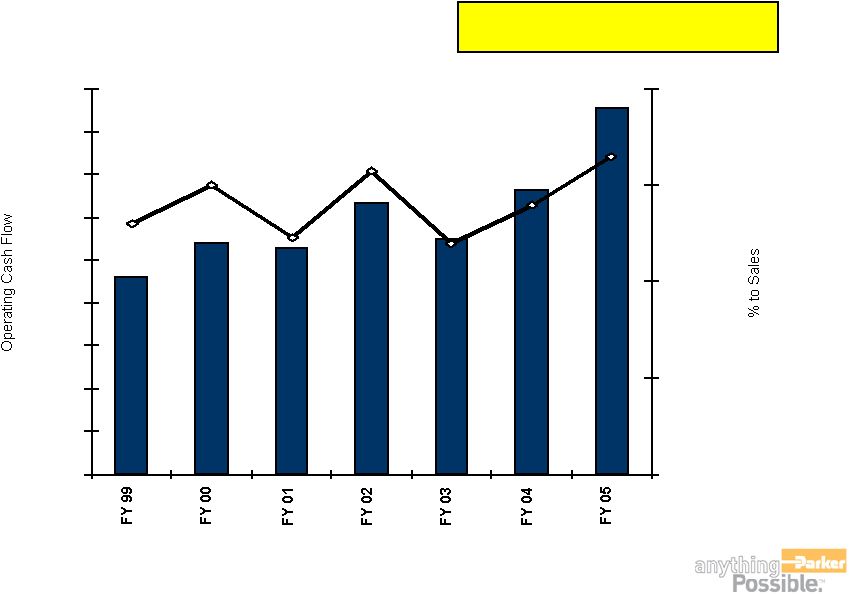 Strong Cash Flow
– Cash From Operations FY06 YTD $610M 459 538 529 631 551 662 854 $0 $100 $200 $300 $400 $500 $600 $700 $800 $900 4.0% 6.0% 8.0% 10.0% 12.0% |
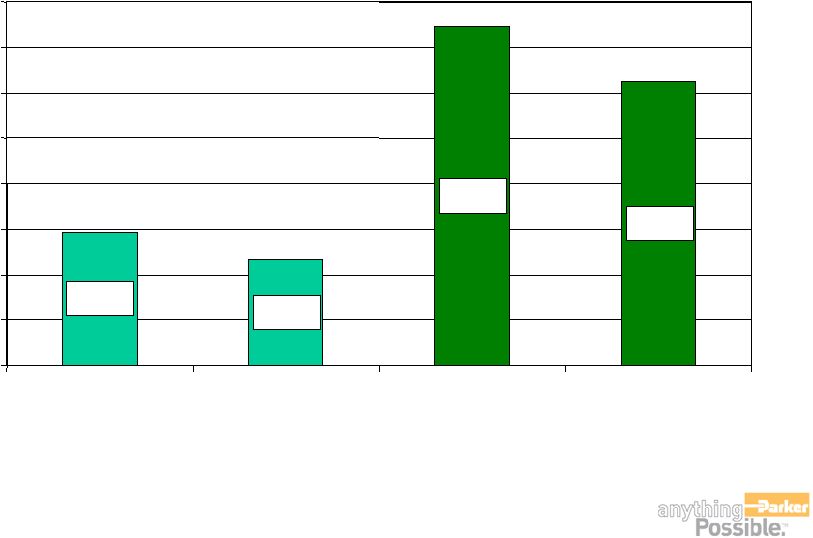
 Financial
Leverage Debt to Debt Equity 27.1% 20.0% 22.0% 24.0% 26.0% 28.0% 30.0% 32.0% 34.0% 36.0% 38.0% FY99 FY00 FY01 FY02 FY03 FY04 FY05 FY06 Target |
 Balance Sheet
Summary Cash Working Capital Inventory Accounts Receivable PP & E Shareholders Equity |
 FY 2006
Earnings Outlook Assumptions Segment Sales & Operating Income FY 2006 Sales Change versus FY 2005 22.0% - 20.0% CIC 9.2% - 8.8% Aerospace 18.2% - 17.5% Industrial ROW 13.6% - 13.2% NA Industrial FY 2006 Operating Margin Percentages 8.3% - 8.0% CIC 14.6% - 14.4% Aerospace 12.1% - 11.9% Industrial ROW 15.0% - 14.8% NA Industrial |
 FY 2006
Earnings Outlook assumptions below Operating Margin Corporate Admin +18.5% to +19.5% vs. FY 2005 Interest Expense +16.0% to +17.0% vs. FY 2005 Other Exp. (Income) * +35.0% to +38.0% vs. FY 2005 Tax Rate 29.0% *Adoption of FAS 123R by the Company will result in additional expense of no
more than $.20 per diluted share in Fiscal Year 2006 all of
which will be reflected in the Other Expense (Income) line. Loss on Sale of Thermoplastics and income from litigation settlement are also included in the Other Expense (Income)
line. |
 Earnings
Outlook Low High Previous guidance, income from continuing operations $4.97 $5.22 including loss from divestiture Revised guidance, income from continuing operations $5.07 $5.22 including loss from divestiture Revised guidance, income from continuing operations $5.15 $5.30 excluding loss from divestiture Previous guidance, income from continuing operations $5.05 $5.30 excluding loss from divestiture |
 Questions &
Answers... |
 Appendix
Income Statements *******************************************************************************************
** ******************************************************************************************
*** ******************************************************************************************
*** ******************************************************************************************
*** *************************** *************************** *************************** *************************** *************************** *************************** *************************** *************************** *************************** *************************** *************************** *************************** *************************** *************************** *************************** *************************** *************************** *************************** *************************** *************************** *************************** *************************** *************************** |
 Income Statement
– 3rd Quarter % of Sales % of Sales Net sales $2,498.1 100.0% $2,112.5 100.0% Cost of sales 1,952.2 78.1% 1,688.8 79.9% Gross profit 545.9 21.9% 423.7 20.1% S, G & A 276.7 11.1% 215.2 10.2% Interest expense 21.0 0.8% 17.1 0.8% Other expense (6.9) -0.3% 2.0 0.1% Income from Cont'g Operations b/f taxes 255.1 10.2% 189.3 9.0% Income taxes 77.5 3.1% 48.7 2.3% Income from Cont'g Operations $177.5 7.1% $140.6 6.7% Discontinued Operations 0.0% (1.3) -0.1% Net Income $177.5 7.1% $139.4 6.6% FY 2006 FY 2005 |
 Income Statement
– 3rd Quarter YTD % of Sales % of Sales Net sales $6,769.2 100.0% $5,896.3 100.0% Cost of sales 5,313.6 78.5% 4,683.4 79.4% Gross profit 1,455.5 21.5% 1,212.9 20.6% S, G & A 759.6 11.2% 627.5 10.6% Interest expense 57.1 0.8% 50.5 0.9% Interest & other income 4.2 0.1% 11.6 0.2% Income from Cont'g Operations b/f taxes 634.6 9.4% 523.4 8.9% Income taxes 184.2 2.7% 146.3 2.5% Income from Cont'g Operations $450.4 6.7% $377.1 6.4% Discontinued Operations $28.9 0.4% $66.2 1.1% Net Income $479.3 7.1% $443.3 7.5% FY 2006 FY 2005 |