 Parker Hannifin
Corporation Quarterly Earnings Release 3rd Quarter FY 2009 April 16, 2009 Exhibit 99.2 |
| Parker Hannifin
Corporation Quarterly Earnings Release 3rd Quarter FY 2009 April 16, 2009 Exhibit 99.2 |
| Slide 2 Forward-Looking Statements Forward-Looking Statements: Forward-looking statements contained in this and other written and oral reports are
made based on known events and circumstances at the time of release, and as such, are subject in the future to unforeseen uncertainties and risks. All statements regarding future
performance, earnings projections, events or developments are
forward-looking statements. It is possible that the future performance
and earnings projections of the company and individual segments may differ
materially from current expectations, depending on economic conditions within its mobile, industrial and aerospace markets, and the company's ability to maintain and achieve
anticipated benefits associated with announced realignment activities,
strategic initiatives to improve operating margins, actions taken to combat the effects of the current recession, and growth, innovation and global diversification initiatives. A change in economic
conditions in individual markets may have a particularly volatile effect on
segment results. Among the other factors which may affect future performance
are: changes in business relationships with and purchases by or from major
customers or suppliers, including delays or cancellations in shipments or
significant changes in financial condition; uncertainties surrounding timing, successful completion or integration of acquisitions; threats associated with and
efforts to combat terrorism; uncertainties surrounding the ultimate
resolution of outstanding legal proceedings, including the outcome of any
appeals; competitive market conditions and resulting effects on sales and
pricing; increases in raw material costs that cannot be recovered in product pricing; the company’s ability to manage costs related to employee retirement and
health care benefits and insurance; and global economic factors, including
manufacturing activity, air travel trends, currency exchange rates,
difficulties entering new markets and general economic conditions such as
inflation, deflation, interest rates and credit availability. The company makes these statements as of the date of this disclosure, and undertakes no obligation to
update them. |
| Slide 3 Non-GAAP Financial Measure This presentation reconciles sales amounts reported in accordance with U.S. GAAP to sales amounts adjusted to remove the effects of acquisitions made within the prior four quarters as well as the effects of currency exchange rates on sales. The effects of acquisitions and currency exchange rates are removed to allow investors and the company to meaningfully evaluate changes in sales on a comparable basis from period to period. |
 Slide 4 Discussion Agenda CEO 3 Quarter Highlights Key Performance Measures & Outlook Questions & Answers CEO Closing Comments rd |
| Slide 5 Third Quarter & YTD Highlights Q3 FY09: Cash Flow/Sales Increased Sequentially to 11.6% Capital Expenditures/Sales Decreased to 2.2% YTD FY09: Cash Flow YTD of $716 Million (8.8% of Sales) Inventory/Sales Reduced to 12.4% (In Line with FY08) |
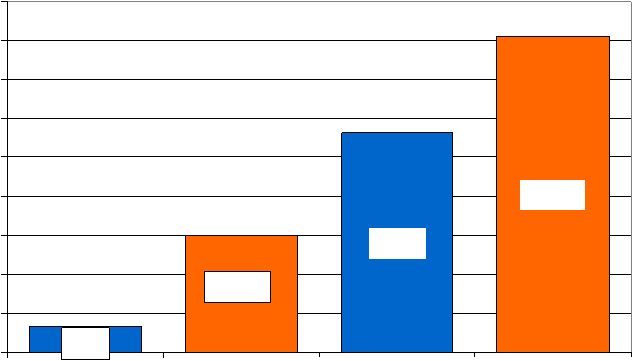 Slide 6 Financial Highlights Diluted Earnings per Share 3 Quarter $1.49 $.33 $2.81 $4.05 $.00 $.50 $1.00 $1.50 $2.00 $2.50 $3.00 $3.50 $4.00 $4.50 Q3 FY09 Q3 FY08 FY09 YTD FY08 YTD rd |
| Slide 7 Influences on 3 rd Quarter Earnings Diluted Earnings Per Share Decreased as a Result of: Lower Sales (26%) Due To A Recession Driven Decline In Most Markets Realignment Expenses of $25M Inventory Reductions of $184M Higher Interest Expense Higher Other Expense Related to Parker ITR Legal Proceedings: $36M Offset by: Lower Corporate, General and Administrative Expenses Lower Tax Expense Due to Decreased Income and Lower Effective Tax Rate Gain From Insurance Settlement of $12M Fewer Shares Outstanding |
 Slide 8 rd Financial Highlights Sales – 3 Quarter and YTD as of March 31 Dollars in millions FY2009 % Change FY2008 FY2009 % Change FY2008 Sales As reported 2,345 $ (26.3)% 3,183 $ 8,098 $ (8.0)% 8,799 $ Acquisitions 146 4.6 % 450 5.1 % Currency (218) (6.9)% (338) (3.9)% Adjusted Sales 2,417 $ (24.0)% 7,986 $ (9.2)% 3rd Quarter Year To Date |
 Slide 9 Influences on Sales Positives: Aerospace Acquisitions Negatives: Global recession Currency |
 Slide 10 Segment Reporting Industrial North America Dollars in millions Sales As reported Acquisitions Currency Adjusted Sales Operating Margin As reported % of Sales FY2009 % Change FY2008 FY2009 % Change FY2008 857 $ (21.2)% 1,087 $ 2,957 $ (4.1)% 3,084 $ 79 7.2 % 241 7.8 % (20) (1.8)% (38) (1.2)% 798 $ (26.6)% 2,754 $ (10.7)% 73 $ 148 $ 341 $ 445 $ 8.5 % 13.6 % 11.5 % 14.4 % Year To Date 3rd Quarter |
 Slide 11 Segment Reporting Industrial International Dollars in millions FY2009 % Change FY2008 FY2009 % Change FY2008 Sales As reported 837 $ (37.8)% 1,346 $ 3,103 $ (14.4)% 3,624 $ Acquisitions 67 5.0 % 191 5.2 % Currency (176) (13.1)% (262) (7.2)% Adjusted Sales 946 $ (29.7)% 3,174 $ (12.4)% Operating Margin As reported 38 $ 217 $ 356 $ 576 $ % of Sales 4.6 % 16.1 % 11.5 % 15.9 % 3rd Quarter Year To Date |
 Slide 12 Segment Reporting Aerospace Dollars in millions FY2009 % Change FY2008 FY2009 % Change FY2008 Sales As reported 480 $ 2.1 % 470 $ 1,432 $ 7.9 % 1,328 $ Acquisitions 18 1.4 % Currency (8) (1.7)% (12) (0.9)% Adjusted Sales 488 $ 3.8 % 1,426 $ 7.4 % Operating Margin As reported 66 $ 68 $ 203 $ 178 $ % of Sales 13.7 % 14.5 % 14.2 % 13.4 % 3rd Quarter Year To Date |
 Slide 13 Segment Reporting Climate & Industrial Controls Dollars in millions FY2009 % Change FY2008 FY2009 % Change FY2008 Sales As reported 171 $ (38.9)% 280 $ 606 $ (20.5)% 762 $ Acquisitions Currency (15) (5.3)% (25) (3.3)% Adjusted Sales 186 $ (33.6)% 631 $ (17.2)% Operating Margin As reported (7) $ 18 $ (5) $ 39 $ % of Sales (4.3)% 6.5 % (0.8)% 5.1 % 3rd Quarter Year To Date |
 Slide 14 Parker Order Rates Excludes Acquisitions & Currency 3-month year-over-year comparisons of total dollars, except Aerospace Aerospace is calculated using a 12-month moving average FY09 FY08 MAR DEC MAR DEC Total Parker 34 % - 20 % - 9 % + 10 % + Industrial North America 35 % - 18 % - 2 % + 4 % + Industrial International 41 % - 28 % - 11 % + 16 % + Aerospace 12 % - 2 % + 28 % + 19 % + Climate & Industrial Controls 36 % - 28 % - 1 % - 6 % - Three Month Rolling at Period End |
| Slide 15 Balance Sheet Summary Cash Working capital - Inventory - Accounts receivable - Accounts payable |
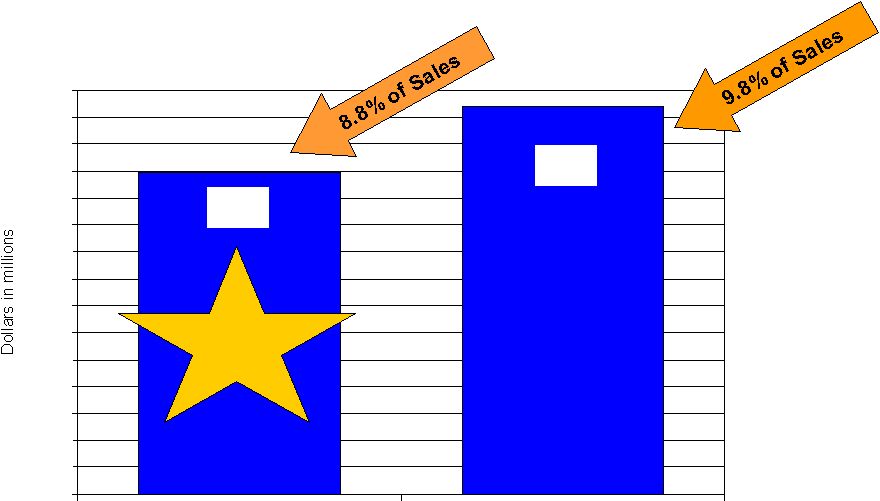 Slide 16 Strong Cash Flow Cash from Operating Activities 3 rd Quarter Year to Date $864 $716 $0 $60 $120 $180 $240 $300 $360 $420 $480 $540 $600 $660 $720 $780 $840 $900 FY09 FY08 11.6% Q3 $272M |
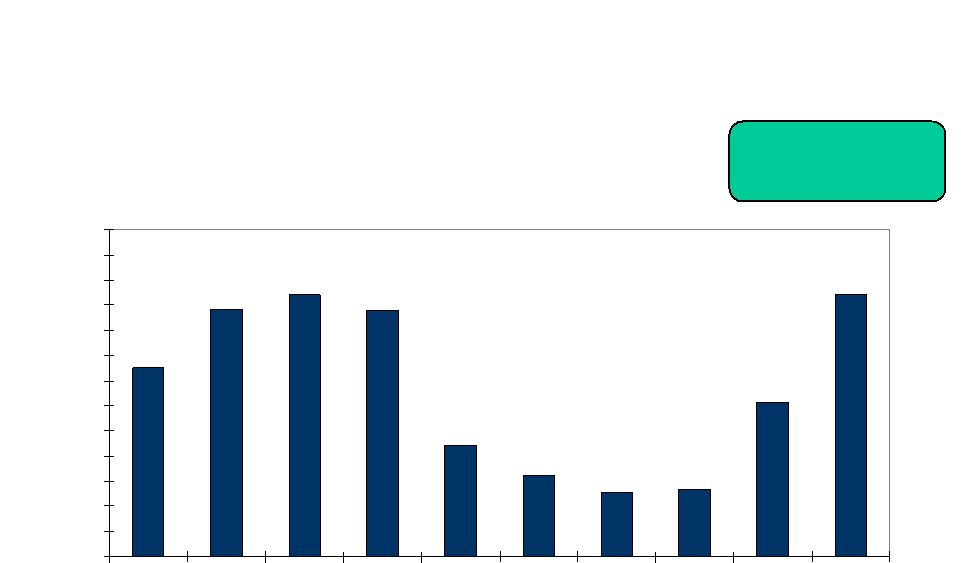 Slide 17 Financial Leverage Debt to Debt Equity 36.8% 16.0% 18.0% 20.0% 22.0% 24.0% 26.0% 28.0% 30.0% 32.0% 34.0% 36.0% 38.0% 40.0% 42.0% FY00 FY01 FY02 FY03 FY04 FY05 FY06 FY07 FY08 FY09 YTD 36.8% Debt to Debt Equity (35.2% net Debt) |
 Slide 18 FY 2009 Earnings Outlook Assumptions Segment Sales & Operating Margins FY 2009 Sales change versus FY 2008 Industrial North America (13.4)% -- (13.2)% Industrial International (22.7)% -- (22.5)% Aerospace 2.3 % -- 2.5 % Climate & Industrial Controls (26.8)% -- (26.6)% FY 2009 Operating margin percentages Industrial North America 10.7 % -- 11.0 % Industrial International 9.5 % -- 9.9 % Aerospace 13.4 % -- 13.7 % Climate & Industrial Controls (.7)% -- (.1)% |
| Slide 19 FY 2009 Earnings Outlook Assumptions below Operating Margin Corporate Admin (5%) to (20%) vs. FY 2008 Interest Expense + 20% to + 6% vs. FY 2008 Other Expense (Inc.) (40%) to + 5% vs. FY 2008 Tax Rate 27 % |
 Slide 20 Earnings Outlook – FY09 Low High Diluted earnings per share $2.95 $3.15 |
 Slide 21 Questions & Answers... |
 Appendix
Income Statements 3 Quarter FY2009 3 Quarter YTD FY2009 rd rd |
 Slide 23 Income Statement – 3 Quarter Dollars in millions % of Sales % of Sales Net Sales 2,344.7 $ 100.0 % 3,182.5 $ 100.0 % Cost of sales 1,908.6 81.4 % 2,447.2 76.9 % Gross profit 436.1 18.6 % 735.3 23.1 % S, G & A 318.0 13.6 % 347.0 10.9 % Interest expense 28.4 1.2 % 25.5 .8 % Other expense (income), net 27.2 1.1 % 5.0 .2 % Income before taxes 62.5 2.7 % 357.8 11.2 % Income taxes 9.1 .4 % 102.4 3.2 % Net income 53.4 $ 2.3 % 255.4 $ 8.0 % FY 2009 FY 2008 rd |
 Slide 24 rd Income Statement – 3 Quarter YTD Dollars in millions % of Sales % of Sales Net Sales 8,098.1 $ 100.0 % 8,798.9 $ 100.0 % Cost of sales 6,367.3 78.6 % 6,763.7 76.9 % Gross profit 1,730.8 21.4 % 2,035.2 23.1 % S, G & A 987.9 12.2 % 990.9 11.3 % Interest expense 86.8 1.0 % 74.0 .8 % Other expense (income), net 39.0 .5 % (1.4) (.0)% Income before taxes 617.1 7.7 % 971.7 11.0 % Income taxes 158.1 2.0 % 274.8 3.1 % Net income 459.0 $ 5.7 % 696.9 $ 7.9 % FY 2009 FY 2008 |